
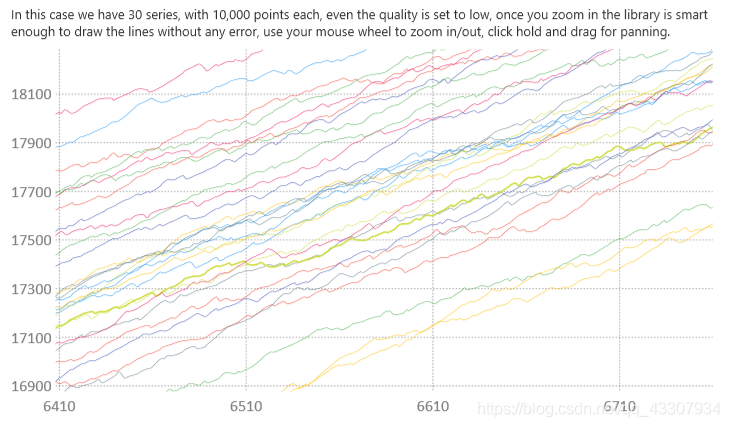
WPF编程,Live Charts使用说明(33)——超大数据(30个系列,每10k点)
本例使用LiveCharts.Geared,齿轮传动包是一个可选的扩展,提升性能LiveCharts后台:using System;using System.Windows.Media;using LiveCharts;using LiveCharts.Geared;namespace Geared.Wpf.MultipleSeriesTest{public cla...
·
本例使用LiveCharts.Geared,geared增强包是一个可选的扩展,提升性能LiveCharts,但收费
后台:
using System;
using System.Windows.Media;
using LiveCharts;
using LiveCharts.Geared;

namespace Geared.Wpf.MultipleSeriesTest
{
    public class MultipleSeriesVm
    {
        public MultipleSeriesVm()
        {
            Series = new SeriesCollection();
            var r = new Random();

            for (var i = 0; i < 30; i++) // 30 series
            {
                var trend = 0d;
                var values = new double[10000];

                for (var j = 0; j < 10000; j++) // 10k points each
                {
                    trend += (r.NextDouble() < .8 ? 1 : -1)*r.Next(0, 10);
                    values[j] = trend;
                }

                var series = new GLineSeries
                {
                    Values = values.AsGearedValues().WithQuality(Quality.Low),
                    Fill = Brushes.Transparent,
                    StrokeThickness = .5,
                    PointGeometry = null //use a null geometry when you have many series
                };
                Series.Add(series);
            }
        }

        public SeriesCollection Series { get; set; }
    }
}
前台:
<UserControl x:Class="Geared.Wpf.MultipleSeriesTest.MultipleSeriesView"
             xmlns="http://schemas.microsoft.com/winfx/2006/xaml/presentation"
             xmlns:x="http://schemas.microsoft.com/winfx/2006/xaml"
             xmlns:mc="http://schemas.openxmlformats.org/markup-compatibility/2006"
             xmlns:d="http://schemas.microsoft.com/expression/blend/2008"
             xmlns:lvc="clr-namespace:LiveCharts.Wpf;assembly=LiveCharts.Wpf"
             xmlns:multipleSeriesTest="clr-namespace:Geared.Wpf.MultipleSeriesTest"
             mc:Ignorable="d"
             d:DesignHeight="300" d:DesignWidth="300">
    <UserControl.DataContext>
        <multipleSeriesTest:MultipleSeriesVm></multipleSeriesTest:MultipleSeriesVm>
    </UserControl.DataContext>
    <Grid>
        <Grid.Resources>
            <Style TargetType="lvc:Separator">
                <Setter Property="Stroke" Value="#69000000"></Setter>
                <Setter Property="StrokeThickness" Value=".8"></Setter>
                <Setter Property="StrokeDashArray" Value="2"></Setter>
            </Style>
        </Grid.Resources>
        <Grid.RowDefinitions>
            <RowDefinition Height="Auto"></RowDefinition>
            <RowDefinition Height="*"></RowDefinition>
        </Grid.RowDefinitions>
        <TextBlock TextWrapping="Wrap">
            In this case we have 30 series, with 10,000 points each,
            even the quality is set to low, once you zoom in the library is smart
            enough to draw the lines without any error, use your mouse wheel to zoom in/out,
            click hold and drag for panning.
        </TextBlock>
        <lvc:CartesianChart Grid.Row="1"
                            DisableAnimations="True"
                            Series="{Binding Series}"
                            DataTooltip="{x:Null}"
                            Zoom="Xy"/>
    </Grid>
</UserControl>

技术共进,成长同行——讯飞AI开发者社区
更多推荐


 0
0 0
0- 0


 已为社区贡献2条内容

所有评论(0)