
嵌入式系统测试利器!这个工具你必须掌握!
本文中提供了一些应用示例,示例取自于模块O-RAN无线通信产品的集成测试过程。
📝 面试求职: 「面试试题小程序」 ,内容涵盖 测试基础、Linux操作系统、MySQL数据库、Web功能测试、接口测试、APPium移动端测试、Python知识、Selenium自动化测试相关、性能测试、性能测试、计算机网络知识、Jmeter、HR面试,命中率杠杠的。(大家刷起来…)
📝 职场经验干货:
01 了解Monit工具
Monit工具是基于Linux系统的一款开源的监控工具,它可以监控系统总体资源利用,对硬件资源和操作系统资源——例如物理设备、虚拟设备、文件系统、网络连接、用户、进程等进行监测和持续跟踪。
另外,它可以调度自定义脚本去实现使用者自定义的检查。Monit工具对宿主Linux的CPU和内存占量很小,虽然它本质上是个监控工具,但因为它开放式的特点,故特别适合用于嵌入式系统的测试。
本文中提供了一些应用示例,示例取自于模块O-RAN无线通信产品的集成测试过程。
02 Monit工具的安装方法
在官方网站
https://mmonit.com/wiki/Monit/Installation下载软件包,
建议使用Pre-built binaries的方式执行安装。
基本过程为:
 $ tar zxvf monit-x.y.z-linux-x64.tar.gz (x.y.z denotes version numbers)
 $ cd monit-x.y.z
 $ cp bin/monit /usr/local/bin/
 $ cp conf/monitrc /etc/
安装步骤示例
1)在系统中创建一个home/monit目录,将软件包上传到该目录中。
root@k8s-master-0:/home/monit# ll
total 2252
drwxr-xr-x  2 root root    4096 Dec  5 10:29 ./
drwxr-xr-x 15 root root    4096 Dec  5 10:29 ../
-rw-r--r-- 1 root root 2293992 Dec 5 10:29 monit-5.34.0-linux-x64.tar.gz2)将软件包解压缩于/home/monit目录中。
root@k8s-master-0:/home/monit# tar zxvf monit-5.34.0-linux-x64.tar.gz
monit-5.34.0/
monit-5.34.0/man/
monit-5.34.0/man/man1/
monit-5.34.0/man/man1/monit.1
monit-5.34.0/conf/
monit-5.34.0/conf/monitrc
monit-5.34.0/CHANGES
monit-5.34.0/bin/
monit-5.34.0/bin/monit
monit-5.34.0/COPYING
root@k8s-master-0:/home/monit# cd monit-5.34.0/
3)设置环境变量。
root@k8s-master-0:/home/monit/monit-5.34.0# cp bin/monit /usr/local/bin/
root@k8s-master-0:/home/monit/monit-5.34.0# cp conf/monitrc /etc/4)运行Monit,检验安装效果。
root@k8s-master-0:/home/monit/monit-5.34.0# monit
 New Monit id: 07b1ed309a9a41cab9df8e7a2e387dad
 Stored in '/root/.monit.id'
Starting Monit 5.34.0 daemon with http interface at [localhost]:2812
或者执行monit -h若能正常显示出帮助信息也说明已安装正确。
root@k8s-master-0:/home/monit/monit-5.34.0# monit -h
Usage: monit [options]+ [command]
Options are as follows:
 -c file       Use this control file
 -d n          Run as a daemon once per n seconds
 -g name       Set group name for monit commands
 -l logfile    Print log information to this file
 -p pidfile    Use this lock file in daemon mode
 -s statefile  Set the file monit should write state information to
 -I            Do not run in background (needed when run from init)
 --id          Print Monit's unique ID
 --resetid     Reset Monit's unique ID. Use with caution
 -B            Batch command line mode (do not output tables or colors)
 -t            Run syntax check for the control file
 -v            Verbose mode, work noisy (diagnostic output)
 -vv           Very verbose mode, same as -v plus log stacktrace on error
 -H [filename] Print SHA1 and MD5 hashes of the file or of stdin if the
               filename is omitted; monit will exit afterwards
 -V            Print version number and patchlevel
 -h            Print this text
Optional commands are as follows:
 start all             - Start all services
 start <name>          - Only start the named service
 stop all              - Stop all services
 stop <name>           - Stop the named service
 restart all           - Stop and start all services
 restart <name>        - Only restart the named service
 monitor all           - Enable monitoring of all services
 monitor <name>        - Only enable monitoring of the named service
 unmonitor all         - Disable monitoring of all services
 unmonitor <name>      - Only disable monitoring of the named service
 reload                - Reinitialize monit
 status [name]         - Print full status information for service(s)
 summary [name]        - Print short status information for service(s)
 report [up|down|..]   - Report state of services. See manual for options
 quit                  - Kill the monit daemon process
 validate              - Check all services and start if not running
 procmatch <pattern>   - Test process matching pattern
root@k8s-master-0:/home/monit/monit-5.34.0#
03 Monit工具的基本配置
在上一节安装示例的步骤4中,我们可以看到monit进程运行后会打开localhost的2812端口,我们可以修改工具的配置文件允许使用者远程访问工具页面。
root@k8s-master-0:/home/monit/monit-5.34.0# vi /etc/monitrc将默认配置中包含的段落
set httpd port 2812 and
    use address localhost  # only accept connection from localhost (drop if you use M/Monit)
    allow localhost        # allow localhost to connect to the server and
allow admin:monit # require user 'admin' with password 'monit'修改为
set httpd port 2812 and
    use address localhost  # only accept connection from localhost (drop if you use M/Monit)
  use address 192.168.1.172
#   allow localhost        # allow localhost to connect to the server and
allow admin:monit # require user 'admin' with password 'monit'重新启动monit。
root@k8s-master-0:/home/monit/monit-5.34.0# monit quit
Monit daemon with pid [2757148] killed
root@k8s-master-0:/home/monit/monit-5.34.0# monit
Starting Monit 5.34.0 daemon with http interface at [192.168.1.72]:2812
而后在测试PC的浏览器中输入192.168.1.72:2812即可看到默认配置下的检查结果,如下图所示。
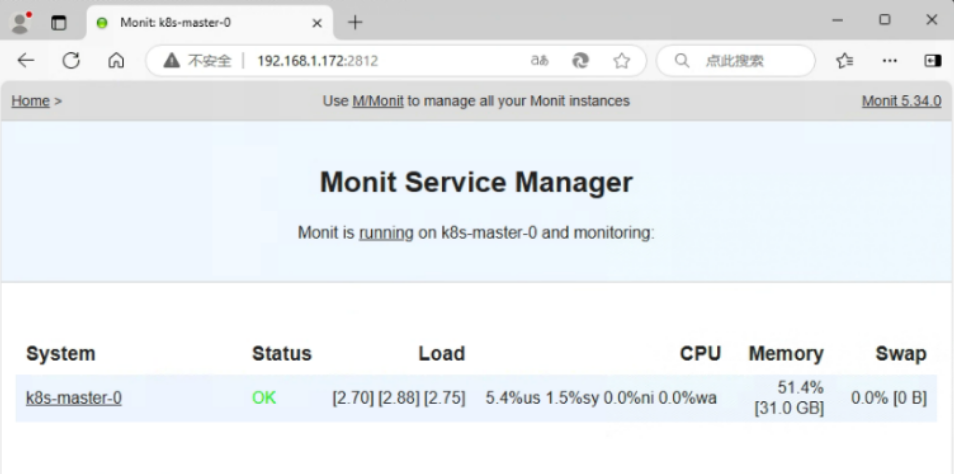
可以看到工具默认会对系统的CPU、内存等负载情况进行展示。
04 使用工具的语法
编写check段落进行测试
可以在/etc/monitrc文件中编写check段落,设计检查项。
vi /etc/monitrc在文件中增加
###监控系统
check system $HOST
    if loadavg (5min) per core > 15 for 10 cycles then alert
    if cpu usage > 70% for 10 cycles then alert
    if memory usage > 70% for 10 cycles then alert
    if swap usage > 25% then alert
##监控5G进程
check process gnbCuMcuNode matching "gnbCuMcuNode"
    if changed pid then alert
        if totalmem > 150.0 MB for 5 cycles then alert
        mode passive
##监控网络接口
check network br_gnbOamNode with interface br_gnbOamNode
    if link down then alert
##监控磁盘
check filesystem os with path /var/log
    if space usage > 95% for 5 cycles then alert
check system段落用于对系统进行检查。本示例中对loadavg、cpu usage、memory usage、swap usage的检查是“且”的关系,若其中一项不符比如内存使用率超出系统最大内存的70%,则判定Status failed。(注:自定义此段落后即覆盖掉上一节的默认检查。)
For xx cycles的意思是检查多轮,避免突发的数据异常影响到结果判定。
可以通过工具web页面看到执行效果,如下图所示的System、Process、Filesystem和Net部分。
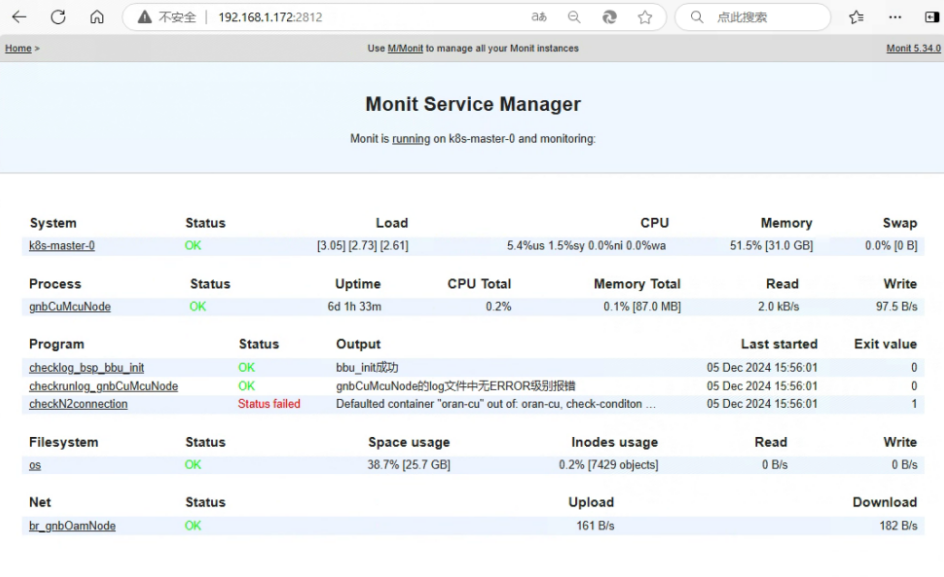
check process段落用于检查系统中运行的进程。本示例中检查了进程ID是否变化过,进程的内存占用是否超出了设计标准。mode passive表示不进行fail状态的后处理(一些监控类任务有做后处理的需求,测试类任务不该有后处理)。
check network段落用于检查系统中运行的网络Device的状态。
check filesystem段落用于检查系统中的文件系统,示例中对缓存文件较频繁的路径/var/log进行容量检查。
除了上述示例的检查外,还可以设计对许多其他资源进行检查,比如单个文件的checksum、文件权限,又比如单个进程的CPU利用率、内存占用率、服务端口连通性、磁盘I/O速率,再比如本地系统与远端host的之间的ping通率、http/dns/mysql等应用层访问的成功率、TCP/UDP下载速率等等,更完善的方法可以在其官网的wiki中寻找到。
不过,手册繁琐,建议初始阶段先照着monitrc配置文件中注释的实例依葫芦画瓢地去用,即已能掌握到最基本的方法。
在ORAN无线通信产品中,进程数、网络设备数通常会达到数十个甚至上百个,测试员依据对全部系统资源或依据对系统设计的了解选择对部分关键资源去进行上百个测试用例设计,经验证这些测试设计能很好的映射到Monit工具的check段落中,通过工具去调度执行,能有效提升测试效率和节省人力。
最后: 下方这份完整的软件测试视频教程已经整理上传完成,需要的朋友们可以自行领取【保证100%免费】


技术共进,成长同行——讯飞AI开发者社区
更多推荐


 15
15 0
0- 0


 已为社区贡献9条内容

所有评论(0)