
自然语言处理:词频、词云、情感分析以及可视化
中文文本处理:词频、词云、情感分析以及可视化
·
*****************************本次演示代码是在jupyter notebook运行的*********************************
一、词频
词频统计有两种方法:1、直接写单词计数逻辑 2、counter函数
Counter是collections模块中的一个类,专门用于对可迭代对象中的元素进行计数,它通过键值对形式存储元素及其计数。无论是列表、元组,还是字符串,只要是可迭代的,Counter都能应用。
代码如下:
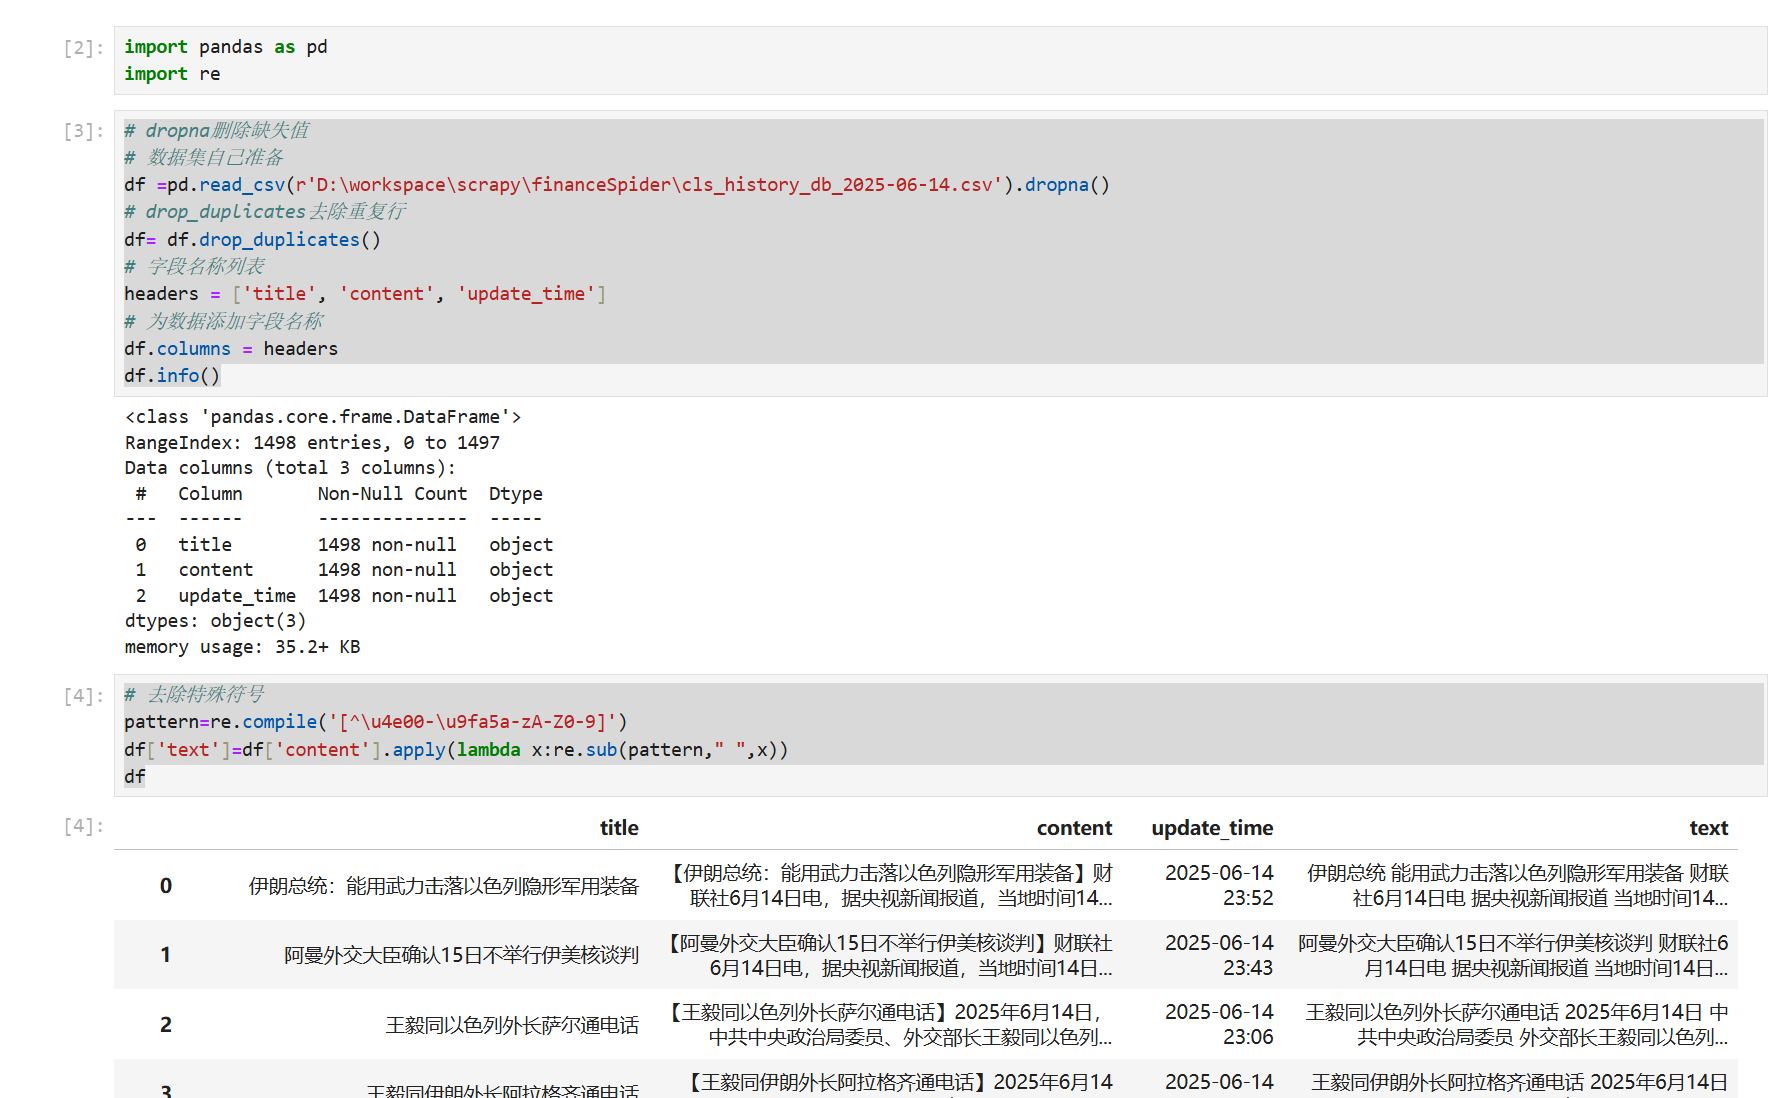
import pandas as pd
import re
# dropna删除缺失值
# 数据集自己准备
df =pd.read_csv(r'D:\workspace\scrapy\financeSpider\cls_history_db_2025-06-14.csv').dropna()
# drop_duplicates去除重复行
df= df.drop_duplicates()
# 字段名称列表
headers = ['title', 'content', 'update_time']
# 为数据添加字段名称
df.columns = headers
df.info()
# 去除特殊符号
pattern=re.compile('[^\u4e00-\u9fa5a-zA-Z0-9]')
df['text']=df['content'].apply(lambda x:re.sub(pattern," ",x))
df
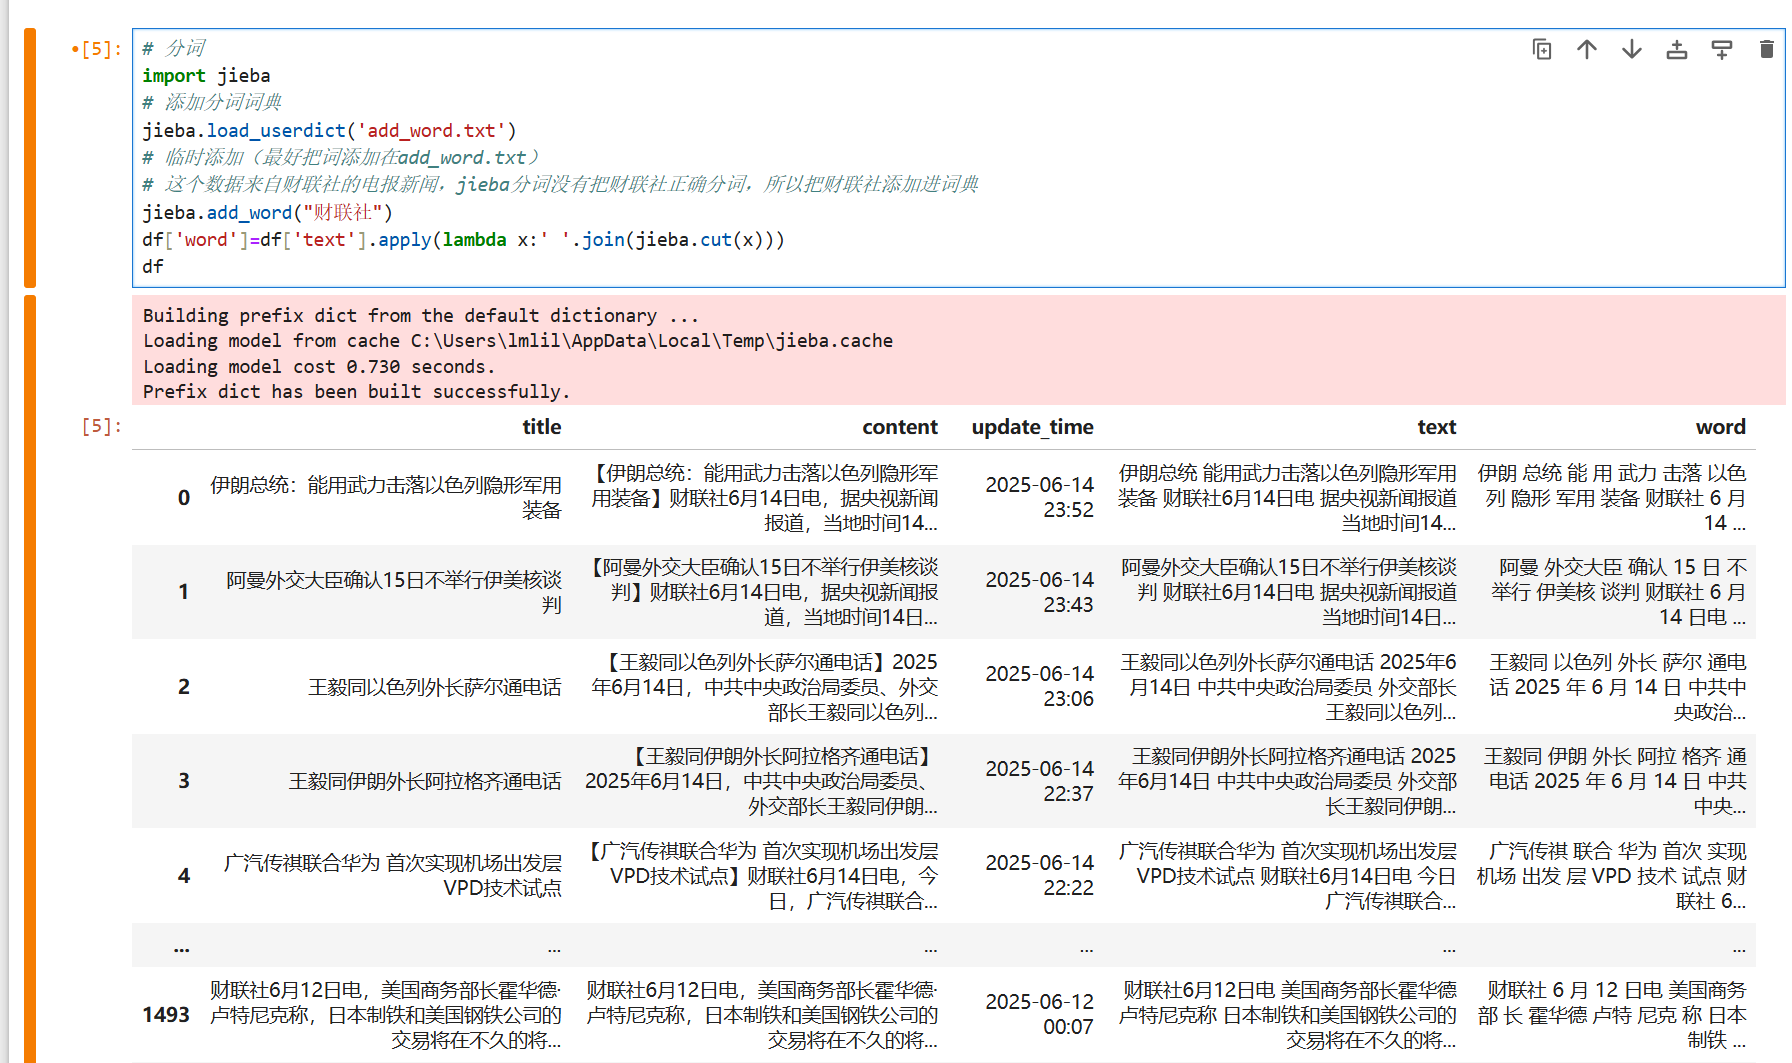
# 分词
import jieba
# 添加分词词典
jieba.load_userdict('add_word.txt')
# 临时添加(最好把词添加在add_word.txt)
# 这个数据来自财联社的电报新闻,jieba分词没有把财联社正确分词,所以把财联社添加进词典
jieba.add_word("财联社")
df['word']=df['text'].apply(lambda x:' '.join(jieba.cut(x)))
df
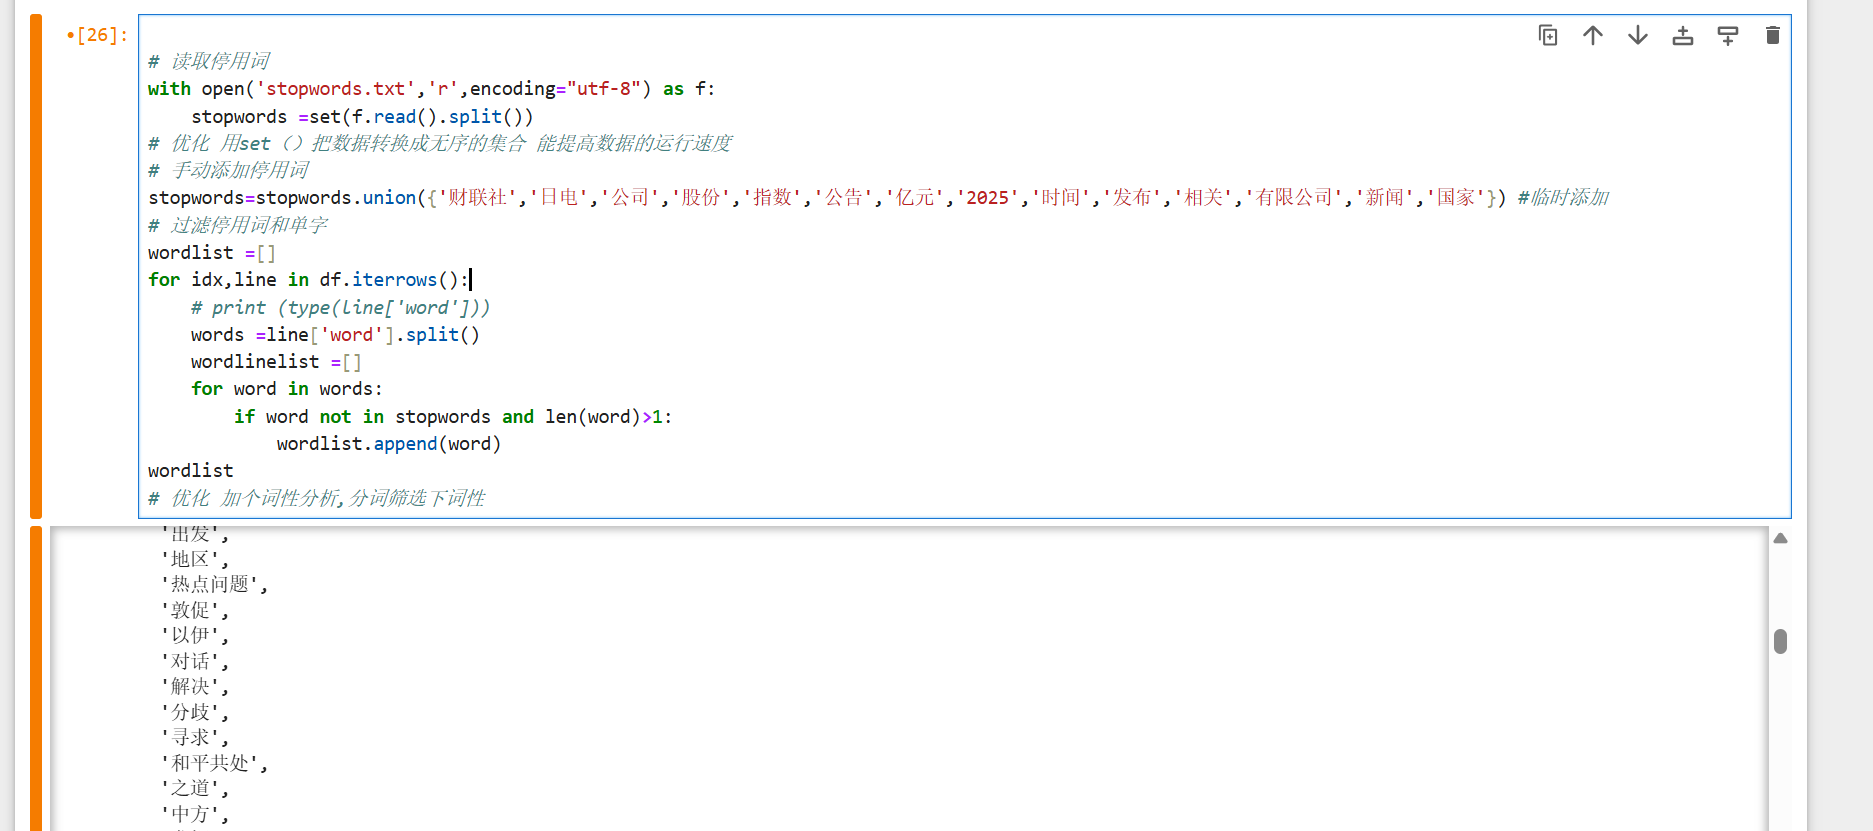
# 读取停用词
with open('stopwords.txt','r',encoding="utf-8") as f:
stopwords =set(f.read().split())
# 优化 用set()把数据转换成无序的集合 能提高数据的运行速度
# 手动添加停用词
stopwords=stopwords.union({'财联社','日电','公司','股份','指数','公告','亿元','2025','时间','发布','相关','有限公司','新闻','国家'}) #临时添加
# 过滤停用词和单字
wordlist =[]
for idx,line in df.iterrows():
# print (type(line['word']))
words =line['word'].split()
wordlinelist =[]
for word in words:
if word not in stopwords and len(word)>1:
wordlist.append(word)
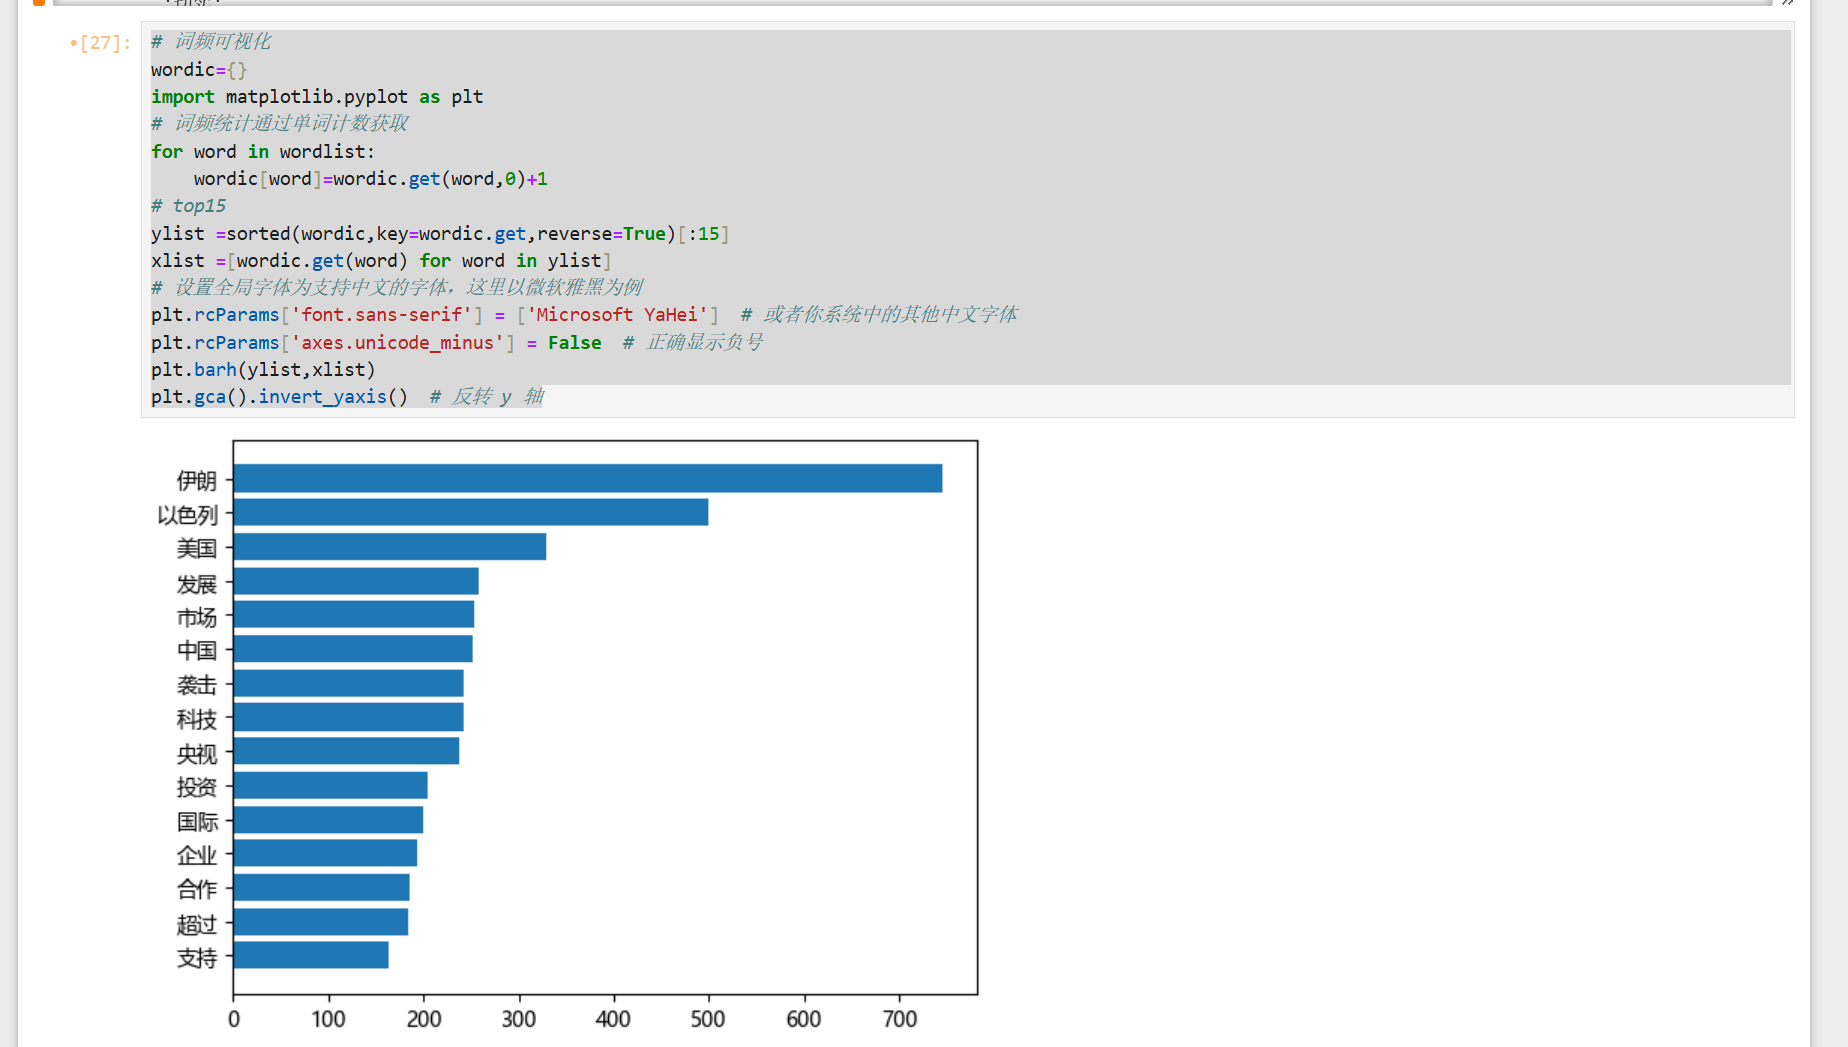
# 词频可视化
wordic={}
import matplotlib.pyplot as plt
# 词频统计通过单词计数获取
for word in wordlist:
wordic[word]=wordic.get(word,0)+1
# top15
ylist =sorted(wordic,key=wordic.get,reverse=True)[:15]
xlist =[wordic.get(word) for word in ylist]
# 设置全局字体为支持中文的字体,这里以微软雅黑为例
plt.rcParams['font.sans-serif'] = ['Microsoft YaHei'] # 或者你系统中的其他中文字体
plt.rcParams['axes.unicode_minus'] = False # 正确显示负号
plt.barh(ylist,xlist)
plt.gca().invert_yaxis() # 反转 y 轴
我发现结巴分词对金融的专业术语分词并不准确,你们可以去网上下载金融词典加进去效果能更好!
二、 词云
词云图片是在网上找的,参考这个博客
python基础词云制作——中国地图_中国地图词云图-CSDN博客
代码如下:
# 词云
from collections import Counter
from wordcloud import WordCloud
import matplotlib.pyplot as plt
from PIL import Image
import numpy as np

# 用Counter方法统计词频,结果是个词典
word_freq=Counter(wordlist)

# 3. 加载中国地图遮罩
mask = np.array(Image.open(r"D:\workspace\spider\china_mask.png"))  # 替换为你的图片路径
# 创建WordCloud对象
# font_path 设置字体路径

wordcloud = WordCloud(
     font_path='C:\Windows\Fonts\simhei.ttf',  #这个是词云字体路径,字体格式一般是在电脑的这个路径下面
     background_color='white',
     mask=mask,
     width=1200,
     height=1200,
     max_words=100
     # contour_width=0.0001,
     # contour_color="brown"

).generate_from_frequencies(word_freq)


# # 显示词云
plt.figure(figsize=(8, 8), facecolor=None)
plt.imshow(wordcloud)
plt.axis("off")
plt.tight_layout(pad=0)
plt.show()
三、情感分析
这次演示用的snownlp,没有的这个库的在命令行下载
下载命令:install -i https://pypi.mirrors.ustc.edu.cn/simple/ snownlp
代码如下:
from snownlp import SnowNLP
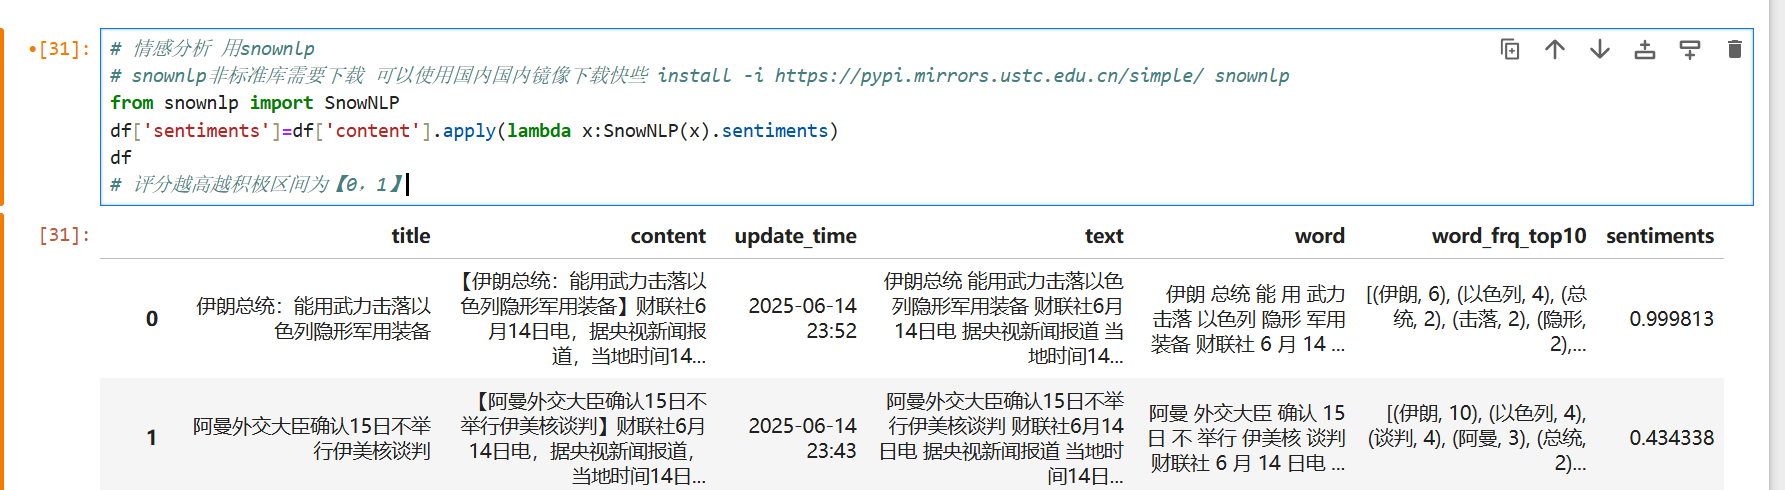
df['sentiments']=df['content'].apply(lambda x:SnowNLP(x).sentiments)
# 评分越高越积极区间为【0,1】# 情感分析 用snownlp
# snownlp非标准库需要下载 可以使用国内国内镜像下载快些 install -i https://pypi.mirrors.ustc.edu.cn/simple/ snownlp
from snownlp import SnowNLP
df['sentiments']=df['content'].apply(lambda x:SnowNLP(x).sentiments)
# 评分越高越积极区间为【0,1】
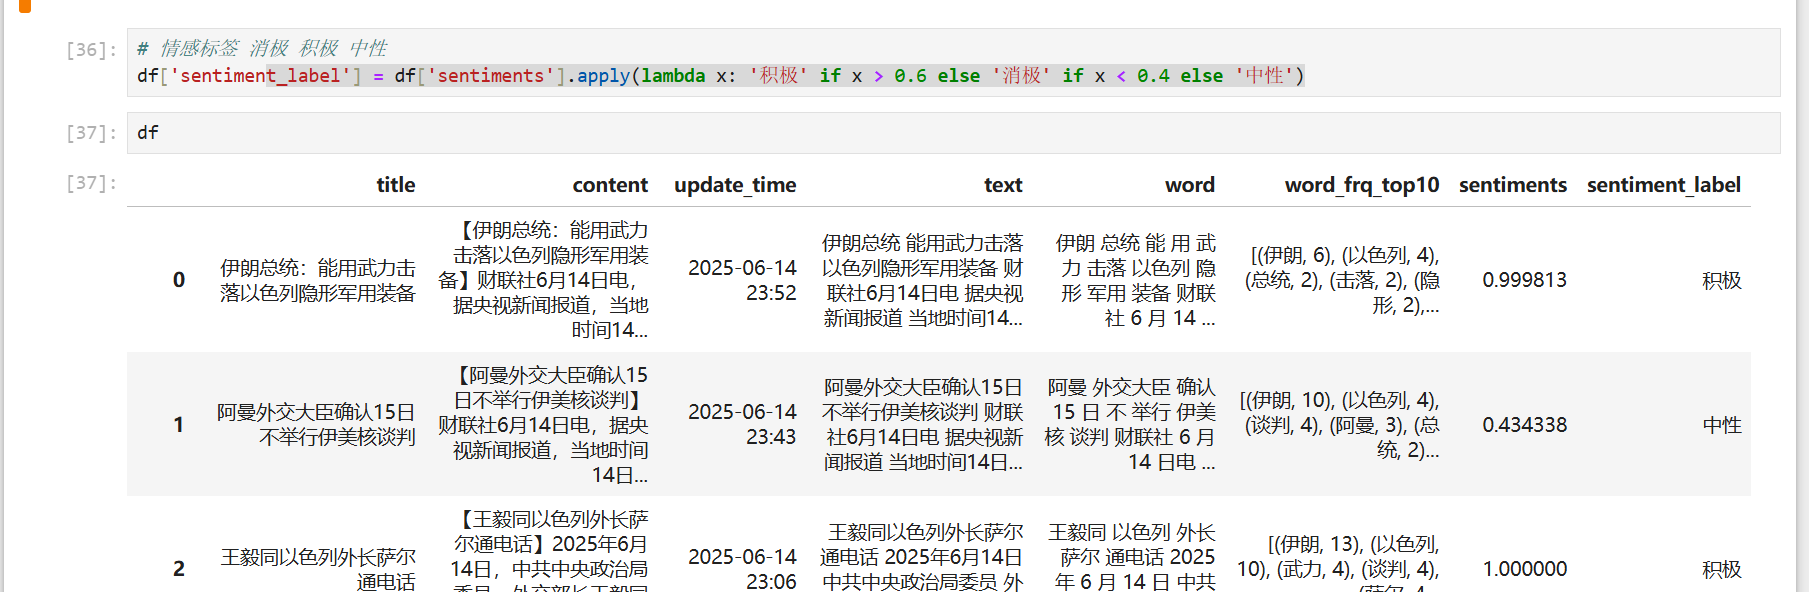
# 情感标签 消极 积极 中性
df['sentiment_label'] = df['sentiments'].apply(lambda x: '积极' if x > 0.6 else '消极' if x < 0.4 else '中性')
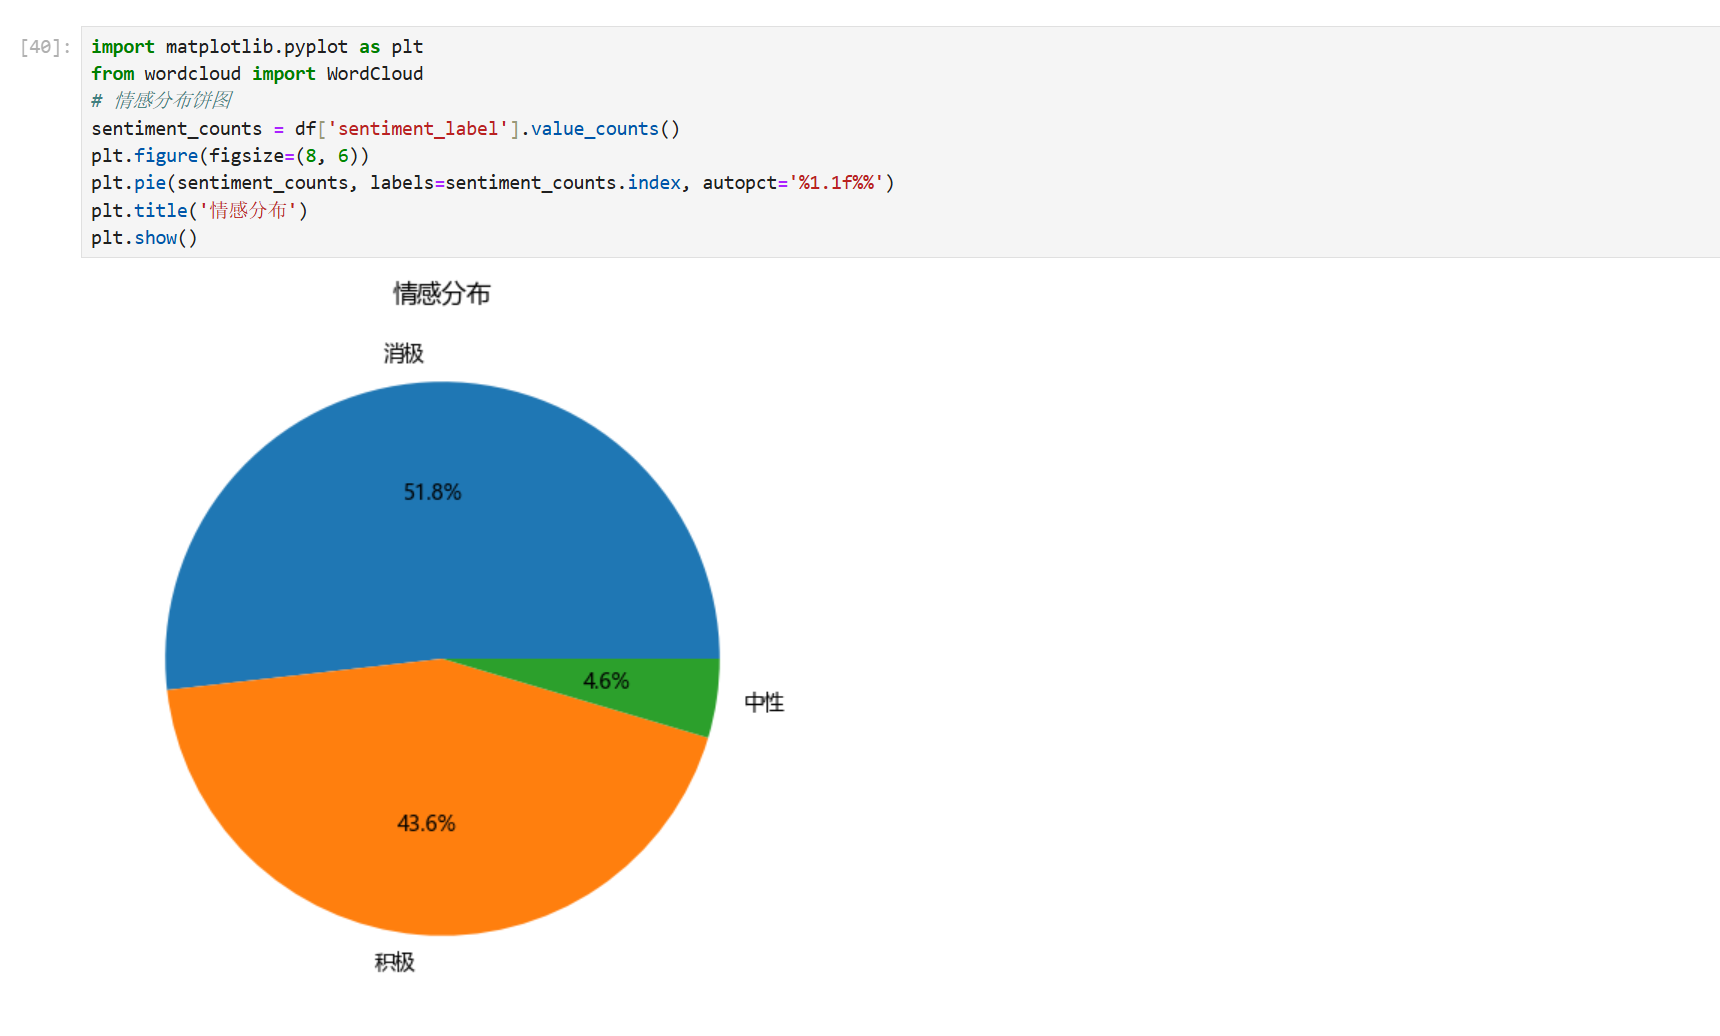
import matplotlib.pyplot as plt
from wordcloud import WordCloud
# 情感分布饼图
sentiment_counts = df['sentiment_label'].value_counts()
plt.figure(figsize=(8, 6))
plt.pie(sentiment_counts, labels=sentiment_counts.index, autopct='%1.1f%%')
plt.title('情感分布')
plt.show()参数:
autopct 是 Matplotlib 饼图绘制函数 plt.pie() 中的一个关键参数,用于控制饼图中每个扇形区域显示的百分比数值格式,默认值为None(不显示百分比数值)。
常用格式:
| 格式字符串 | 效果示例 | 说明 |
|---|---|---|
'%1.0f%%' |
15% | 整数百分比(四舍五入) |
'%1.1f%%' |
15.4% | 保留1位小数(默认推荐) |
'%1.2f%%' |
15.42% | 保留2位小数 |
'%.2f%%' |
15.42% | 同上(更简洁写法) |
'%d%%' |
15% | 强制整数显示(不四舍五入) |

技术共进,成长同行——讯飞AI开发者社区
更多推荐
 20
20 0
0- 0


 已为社区贡献3条内容

所有评论(0)