
echarts折线图多条折线展示数据错乱(已解决)
解决echarts多条折线图,展示数据错乱
·
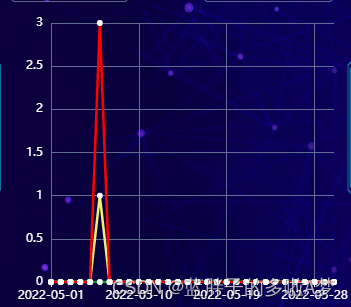
使用echarts折现多跟线图直接用官方案例的时候,就是数据和绘制图对不上的问题:
stack: “Total”,//把这个stack去掉或者设置不同数值
series: [
     {
            name: "异常",
            type: "line",
            stack: "Total",//把这个stack去掉或者设置不同数值
            data: this.abnormalList,
            itemStyle: {
              borderColor: "#f0f075",
              color: "#ffffff",
              borderWidth: 2.5,
            },
            lineStyle: {
              color: "#f0f075",
              width: 2.5,
            },
   },

技术共进,成长同行——讯飞AI开发者社区
更多推荐


 17
17 0
0- 0


 已为社区贡献2条内容

所有评论(0)