
java动态生成污染玫瑰图
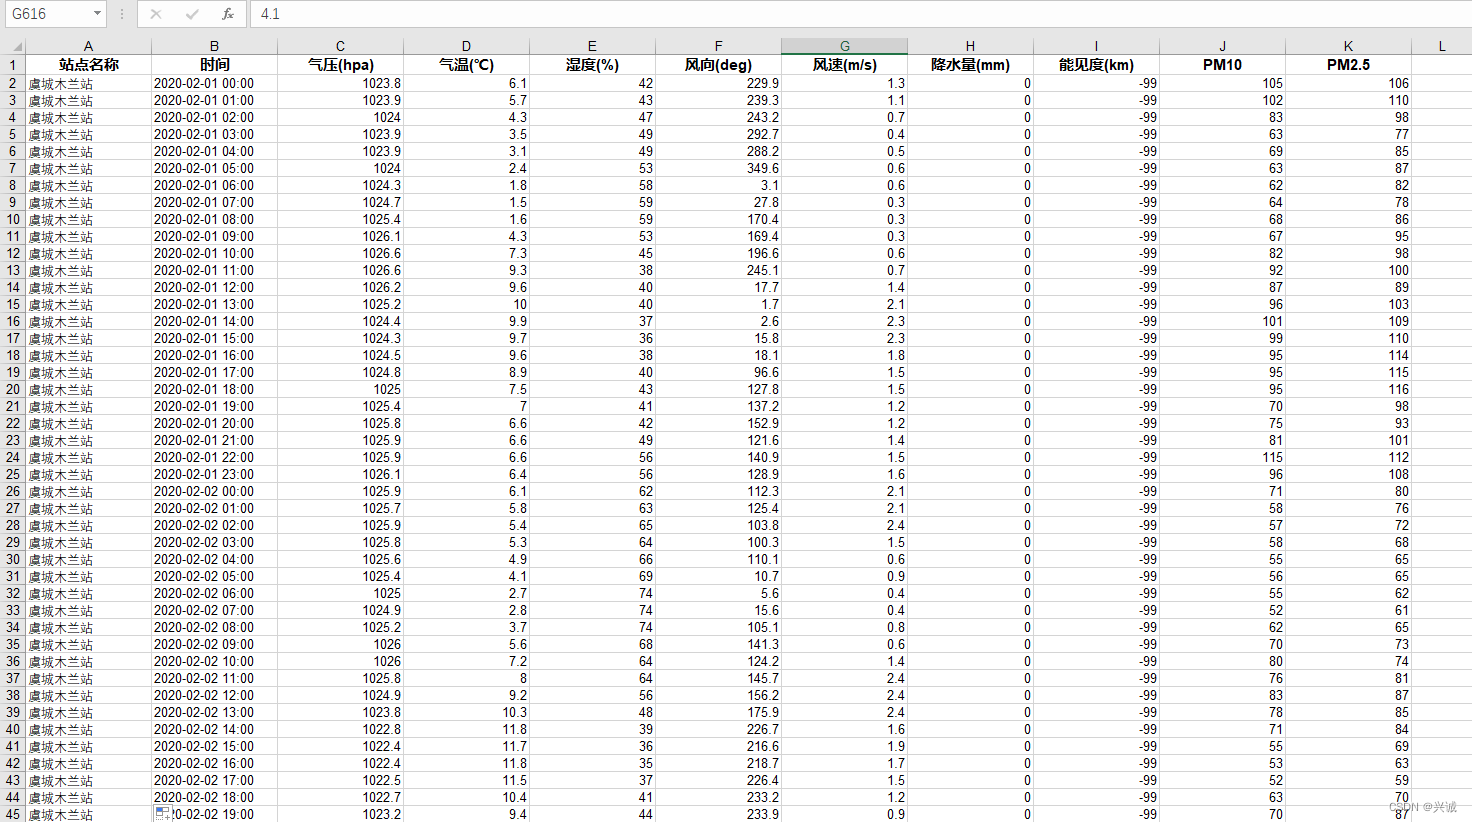
/站点名称时间气压(hpa)气温(℃)湿度(%)风向(deg)风速(m/s)降水量(mm)能见度(km)PM10PM2.5。三、编写java服务代码调用python生成污染玫瑰图成果文件。//workbook将Excel写入到文件。一、java动态生成Excel输入文件。二、编写python代码实现。五、生成污染玫瑰图成果图。
·
一、java动态生成Excel输入文件
关键代码实现:
// 表头数据
String[] header = {"index","stationName","stationTypeId","x","y","time","AQI","PM25","PM10","SO2","NO2","CO","O3","PMI"};
//站点名称    时间    气压(hpa)    气温(℃)    湿度(%)    风向(deg)    风速(m/s)    降水量(mm)    能见度(km)    PM10    PM2.5

//声明一个工作簿
HSSFWorkbook workbook = new HSSFWorkbook();
//生成一个表格
HSSFSheet sheet = workbook.createSheet("sheet1");

// 写入头部
HSSFRow headrow = sheet.createRow(0);
for (int i=0; i<header.length; i++) {
    headrow.createCell(i).setCellValue(header[i]);
}

SimpleDateFormat dateFormat = new SimpleDateFormat("yyyy/MM/dd HH:mm");
for (int i=0; i<datalist.size(); i++) {
    HSSFRow row = sheet.createRow(i+1);
    StationWithData data = datalist.get(i);
    row.createCell(0).setCellValue(i+1);
    row.createCell(1).setCellValue(data.getStationName());
    row.createCell(2).setCellValue(data.getStationTypeId());
    if (data.getLongitude() != null) {
        row.createCell(3).setCellValue(data.getLongitude().doubleValue());
    }
    if (data.getLatitude() != null) {
        row.createCell(4).setCellValue(data.getLatitude().doubleValue());
    }
    if (data.getMonitorTime() != null) {
        row.createCell(5).setCellValue(dateFormat.format(data.getMonitorTime()));
    }
    if (data.getAqi() != null) {
        row.createCell(6).setCellValue(data.getAqi().doubleValue());
    }
    if (data.getPm25() != null) {
        row.createCell(7).setCellValue(data.getPm25().doubleValue());
    }
    if (data.getPm10() != null) {
        row.createCell(8).setCellValue(data.getPm10().doubleValue());
    }
    if (data.getSo2() != null) {
        row.createCell(9).setCellValue(data.getSo2().doubleValue());
    }
    if (data.getNo2() != null) {
        row.createCell(10).setCellValue(data.getNo2().doubleValue());
    }
    if (data.getCo() != null) {
        row.createCell(11).setCellValue(data.getCo().doubleValue());
    }
    if (data.getO3() != null) {
        row.createCell(12).setCellValue(data.getO3().doubleValue());
    }
    if (data.getPmi() != null) {
        row.createCell(13).setCellValue(data.getPmi().doubleValue());
    }
}

try {
    //workbook将Excel写入到文件
    File file = new File(excelPath);
    if (!file.exists()) {
        boolean flag = file.mkdirs();
        System.out.println(flag);
    }
    SimpleDateFormat sdf = new SimpleDateFormat("yyyyMMddHH");
    FileOutputStream os = new FileOutputStream(excelPath + "\\" + sdf.format(new Date()) + ".xls");
    workbook.write(os);

    //刷新缓冲
    os.flush();
    os.close();
    //this.execPython(scriptPath, pythonParam, pythonParam + File.separator + "wryt" + File.separator + "wrytexcel" + File.separator + sdf.format(new Date()) + ".xls");
    this.execPython(scriptPath, pythonParam, excelPath + File.separator + sdf.format(new Date()) + ".xls");
} catch(Exception e) {
    e.printStackTrace();
}
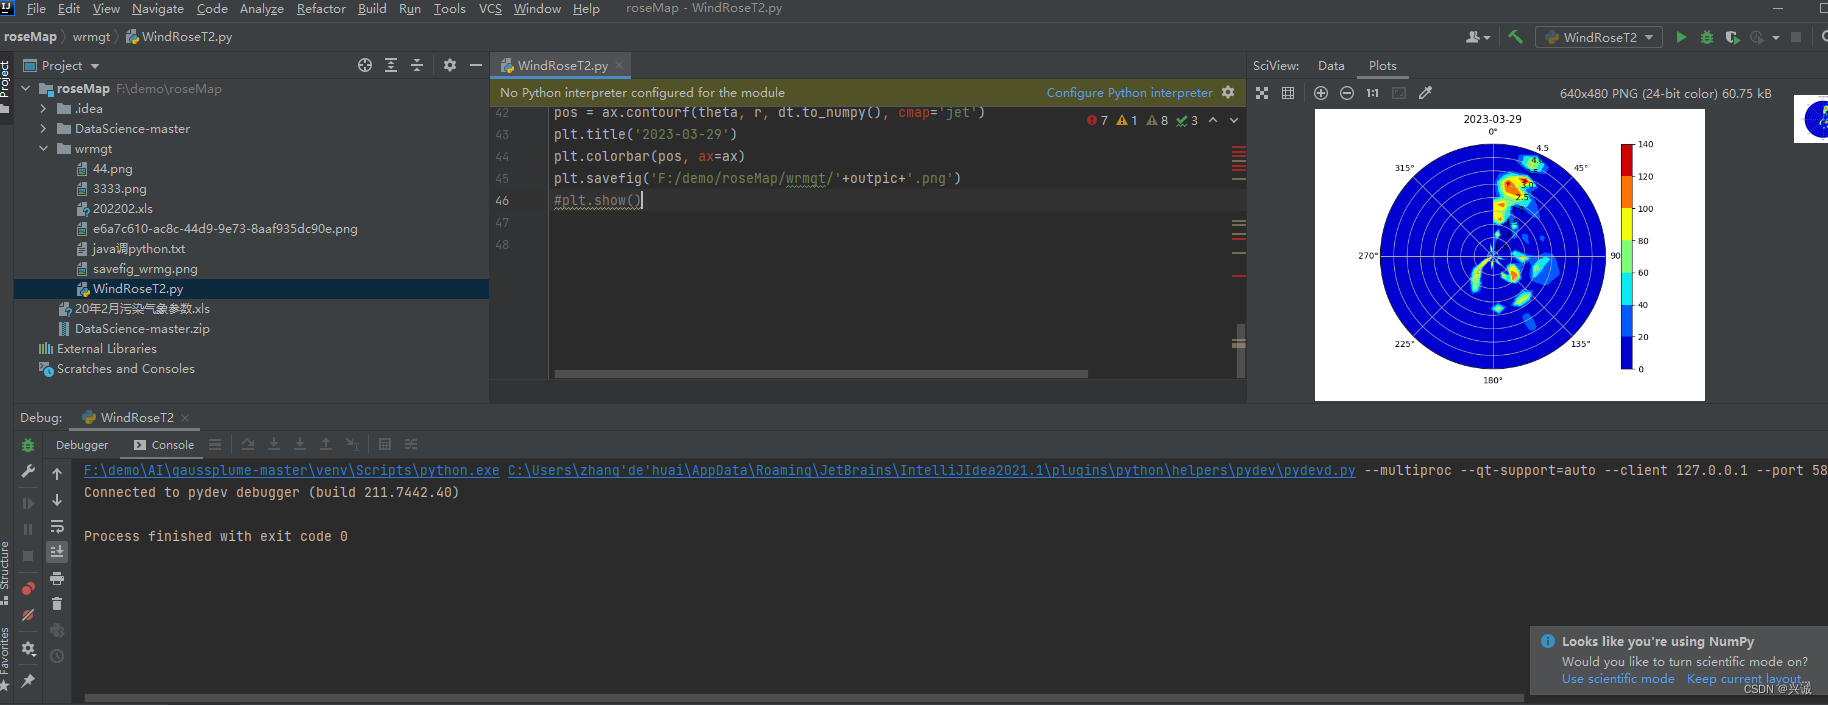
二、编写python代码实现
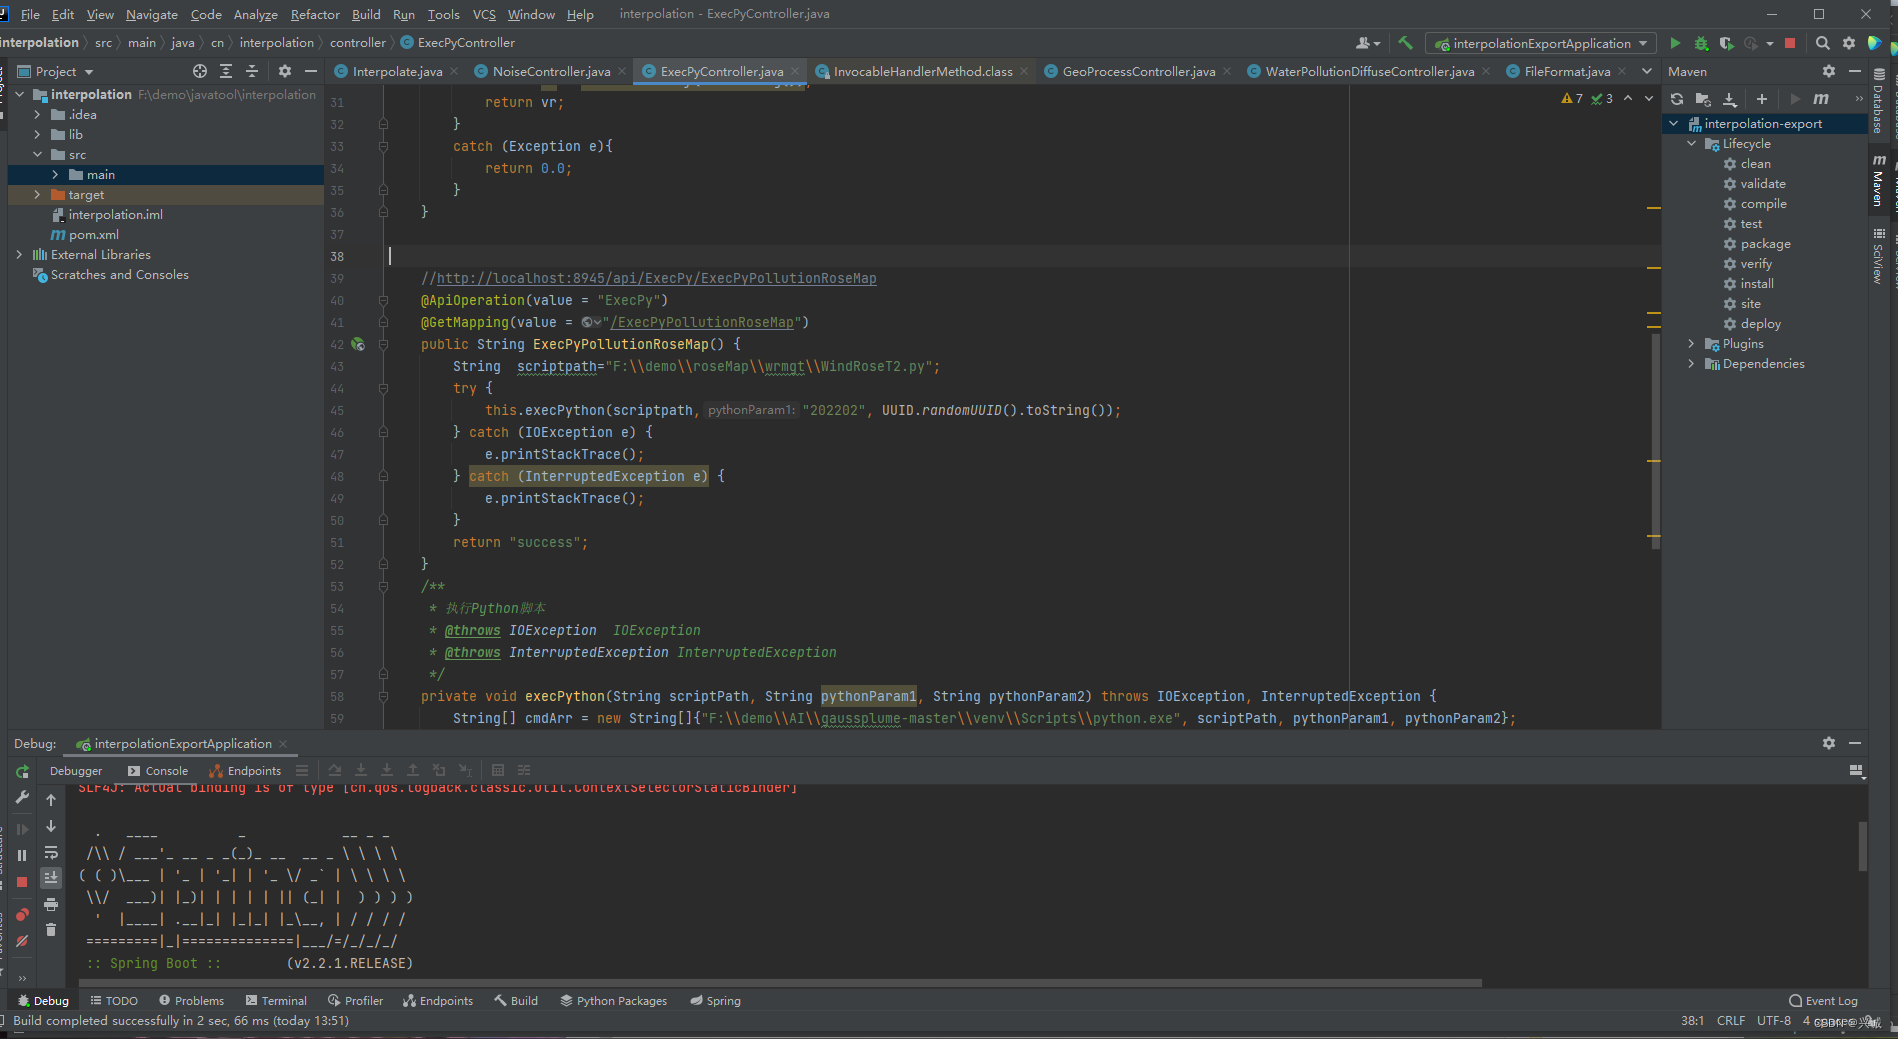
三、编写java服务代码调用python生成污染玫瑰图成果文件
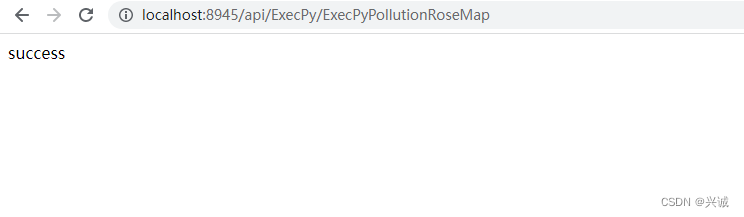
四、网络调用
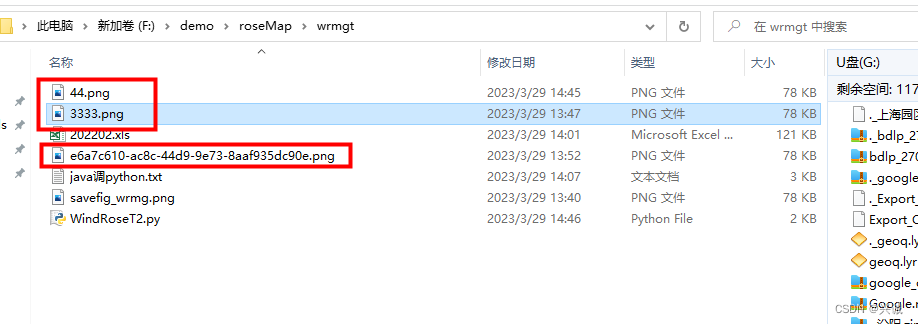
五、生成污染玫瑰图成果图
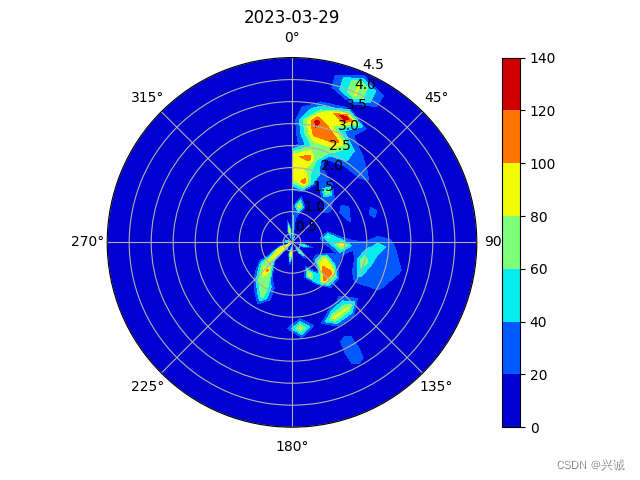
技术合作交流qq:2401315930
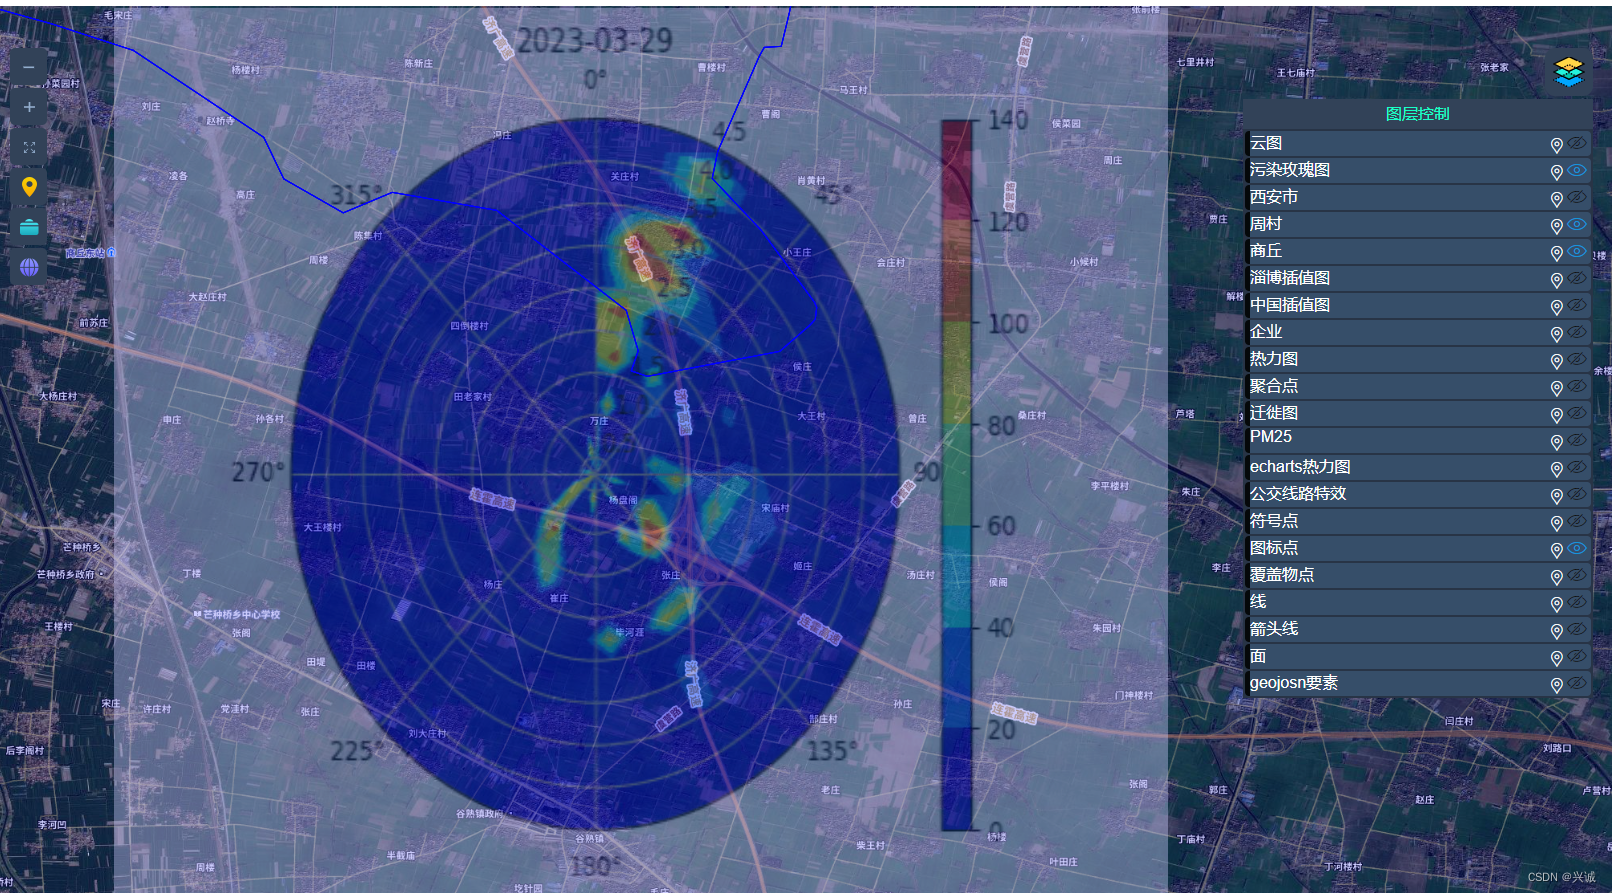
六、融合GIS展示时段内污染物的扩散方向方位和浓度可视化

技术共进,成长同行——讯飞AI开发者社区
更多推荐
 0
0 0
0- 0


 已为社区贡献9条内容

所有评论(0)