
python matplotlib画出Dirivhlet分布的单纯形图
参考文献File:Dirichlet.pdf, From Wikipedia, the free encyclopedia画出Dirichlet分布的单纯形图代码import numpy as npimport matplotlibimport matplotlib.pyplot as pltimport matplotlib.tri as trifrom mpl_toolkits.axes_gr
·
参考文献
代码
import numpy as np
import matplotlib
import matplotlib.pyplot as plt
import matplotlib.tri as tri
from mpl_toolkits.axes_grid1.inset_locator import inset_axes
# Add font family "Microsoft YaHei" to support Chinese.
# matplotlib.rcParams['font.family'].insert(0, 'Microsoft YaHei')
font_size = 22
matplotlib.rcParams.update({
'figure.facecolor': 'white',
'legend.fontsize': font_size,
'axes.labelsize': font_size,
'axes.titlesize': font_size,
'xtick.labelsize': font_size,
'ytick.labelsize': font_size,
})
# 生成等边三角形
corners = np.array([[0, 0], [1, 0], [0.5, 0.75 ** 0.5]])
triangle = tri.Triangulation(corners[:, 0], corners[:, 1])
# 每条边中点位置
midpoints = [(corners[(i + 1) % 3] + corners[(i + 2) % 3]) / 2.0 for i in range(3)]
# 将三角形顶点的笛卡尔坐标映射到重心坐标系
def xy2bc(xy, tol=1.e-3):
s = [(corners[i] - midpoints[i]).dot(xy - midpoints[i]) / 0.75 for i in range(3)]
return np.clip(s, tol, 1.0 - tol)
# 有了重心坐标,可以计算Dirichlet概率密度函数的值
class Dirichlet(object):
def __init__(self, alpha):
from math import gamma
from operator import mul
from functools import reduce
self.alpha = np.array(alpha)
self._coef = gamma(np.sum(self.alpha)) / reduce(mul, [gamma(a) for a in self.alpha]) # reduce:sequence连续使用function
def pdf(self, x):
# 返回概率密度函数值
from operator import mul
from functools import reduce
return self._coef * reduce(mul, [xx ** (aa - 1) for (xx, aa) in zip(x, self.alpha)])
def draw_pdf_contours(dist, nlevels=200, subdiv=8, filename=None, **kwargs):
# 细分等边三角形网格
refiner = tri.UniformTriRefiner(triangle)
trimesh = refiner.refine_triangulation(subdiv=subdiv)
pvals = [dist.pdf(xy2bc(xy)) for xy in zip(trimesh.x, trimesh.y)]
fig, ax = plt.subplots(dpi=300)
ax.set_aspect('equal')
# 画出 color bar
tcf = ax.tricontourf(trimesh, pvals, nlevels, cmap='Blues', **kwargs)
axins = inset_axes(ax,
width="5%", # width = 10% of parent_bbox width
height="80%", # height : 50%
loc='upper left',
bbox_to_anchor=(0.99, 0., 1, 1),
bbox_transform=ax.transAxes,
borderpad=0,
)
fig.colorbar(tcf, cax=axins)
# 画三角图(单纯性图)
ax.tricontour(trimesh, pvals, nlevels, linewidths=0.2, **kwargs)
ax.set_xlim(0, 1)
ax.set_ylim(0, 0.75 ** 0.5)
ax.set_axis_off()
ax.plot([0, 0.5], [0, 0.75 ** 0.5], c='black', linewidth=0.5)
ax.plot([0.5, 1], [0.75 ** 0.5, 0], c='black', linewidth=0.5)
ax.plot([0, 1], [0, 0], c='black', linewidth=1)
# 给三个顶点添加文本注释
ax.text(0.32, 0.9, r'$\mathbf{p}=(0, 0, 1)$', fontsize=font_size)
ax.text(-0.2, -0.07, r'$\mathbf{p}=(1, 0, 0)$', fontsize=font_size)
ax.text(0.8, -0.07, r'$\mathbf{p}=(0, 1, 0)$', fontsize=font_size)
ax.set_title(r'$\mathbf{\alpha}=(%s)$' %
(", ".join([format(i, ".1f") for i in dist.alpha])),
y=-0.25)
# 保存文件并显示图片
if filename:
plt.savefig(filename + '.png', bbox_inches='tight')
plt.savefig(filename + '.eps', format='eps', bbox_inches='tight')
plt.show()
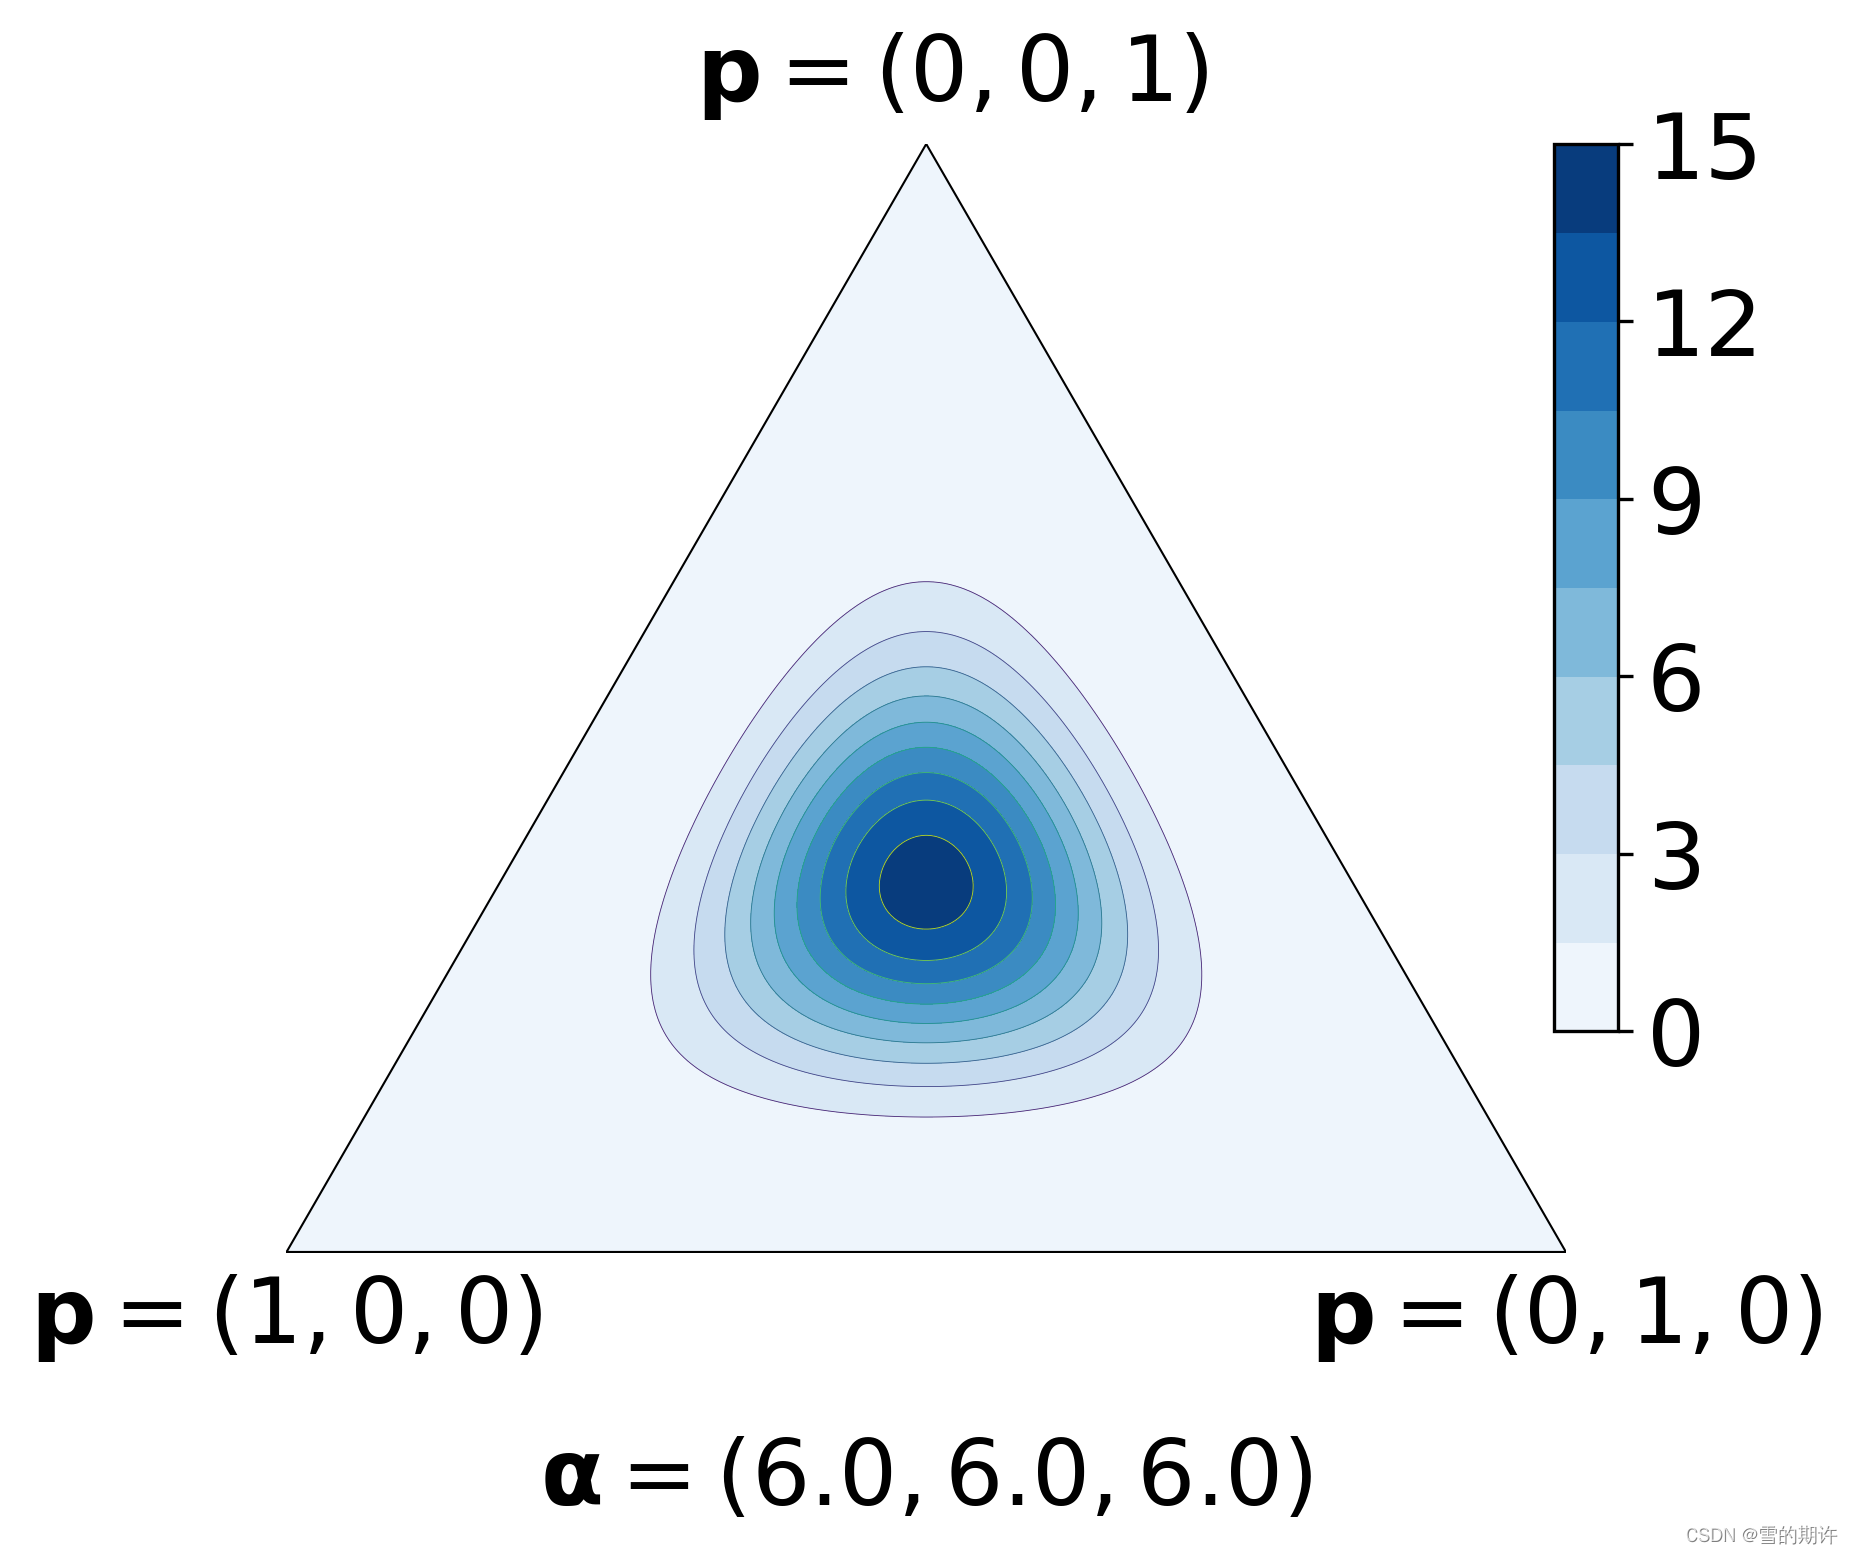
draw_pdf_contours(Dirichlet([6, 6, 6]), nlevels=10, filename='dirichlet-total')
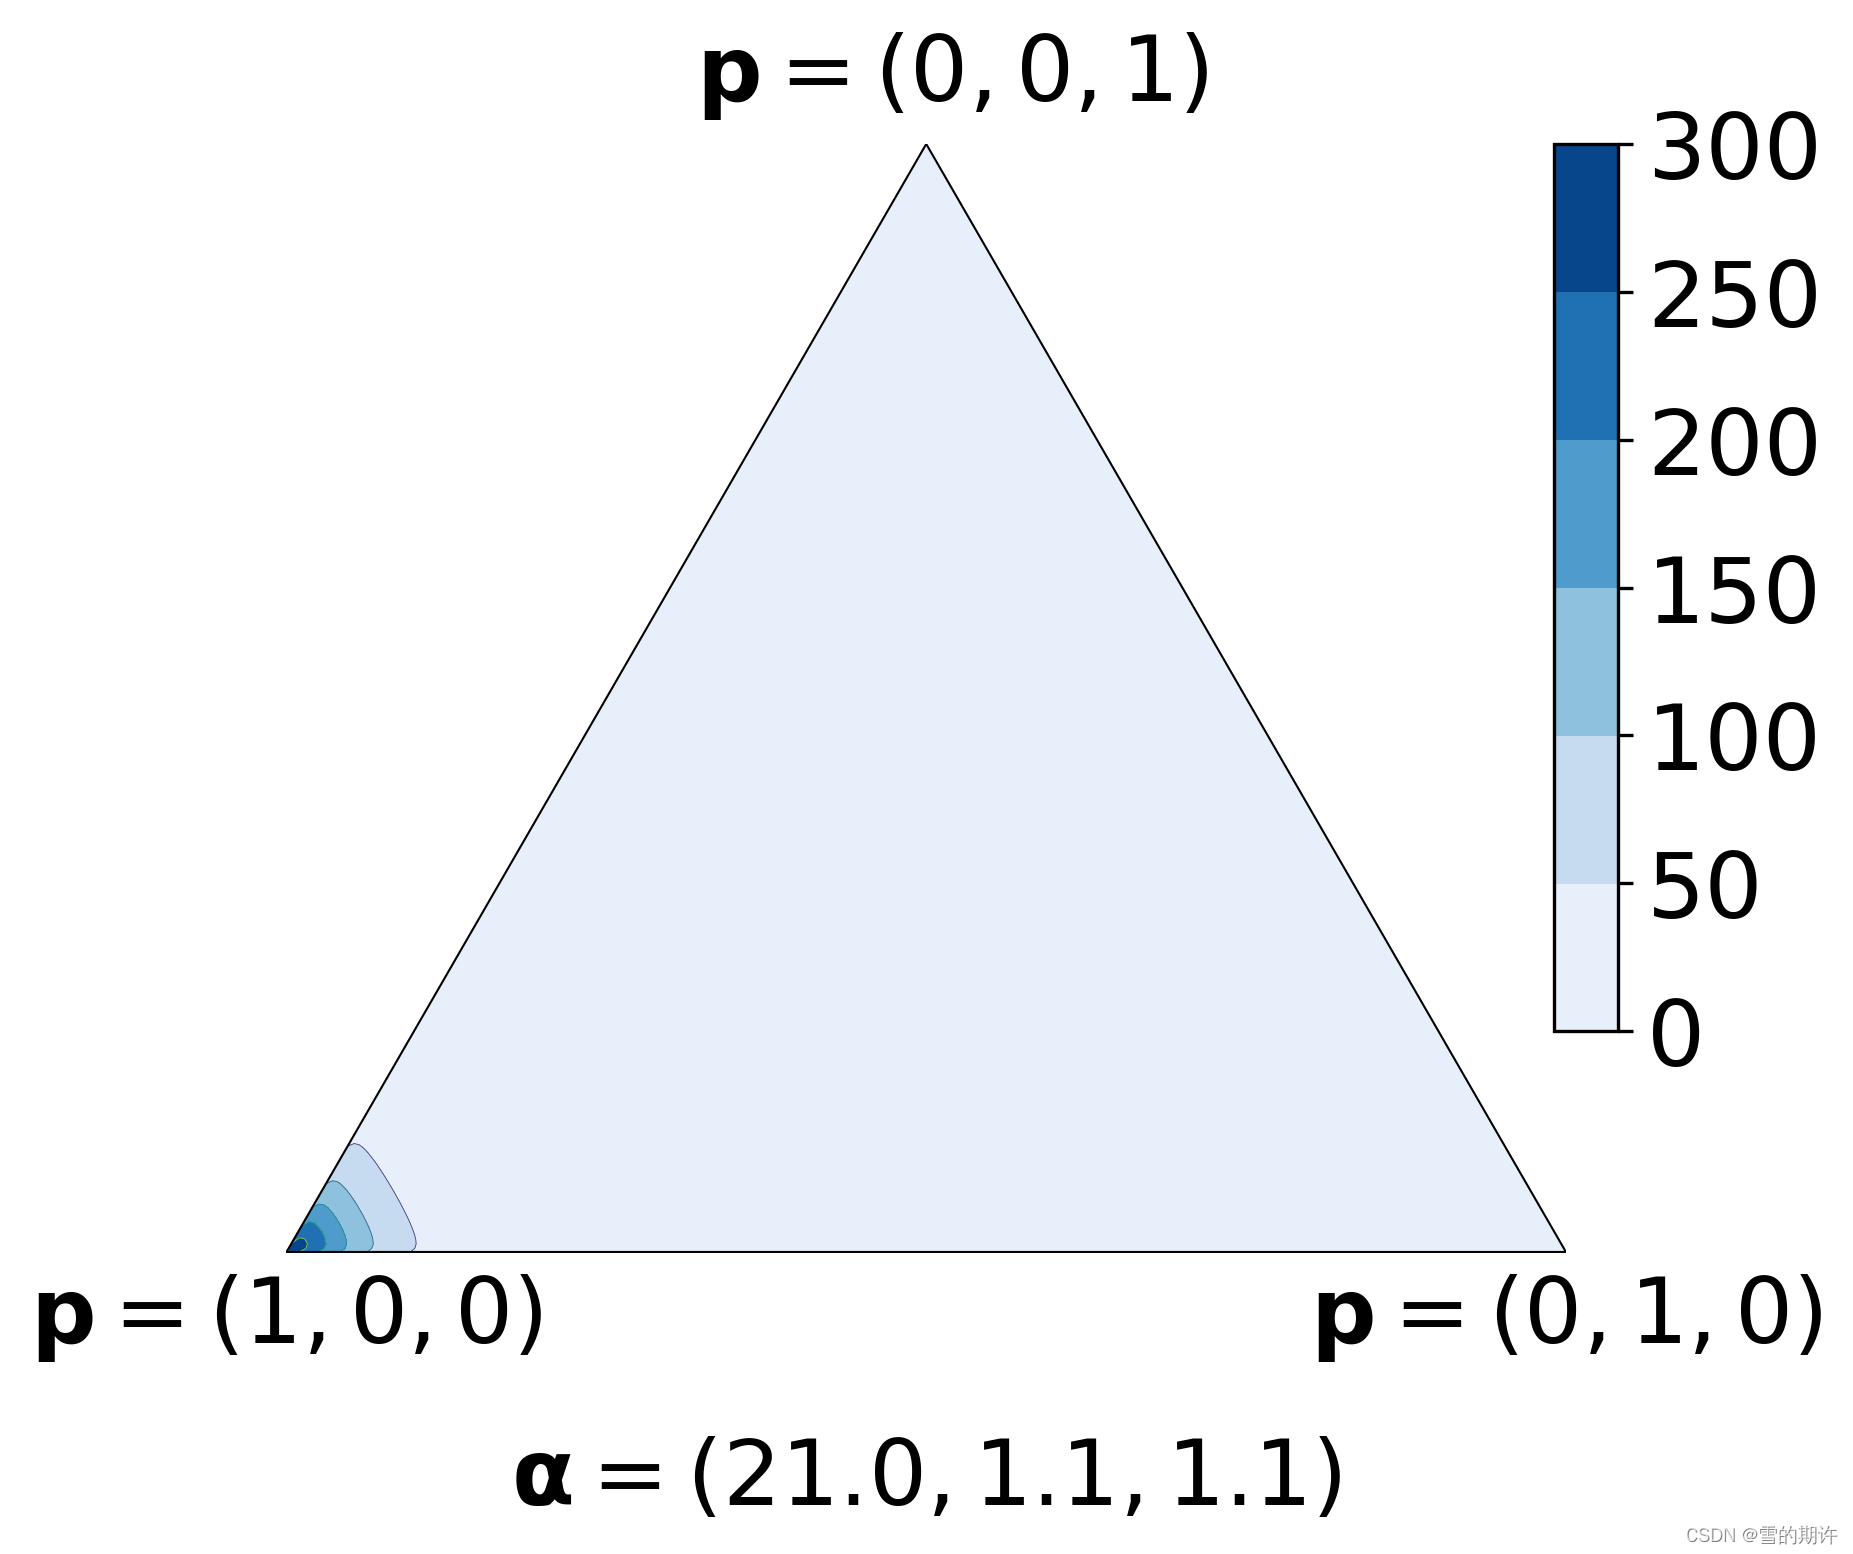
draw_pdf_contours(Dirichlet([21, 1.1, 1.1]), nlevels=5, filename='dirichlet-confident_prediction')
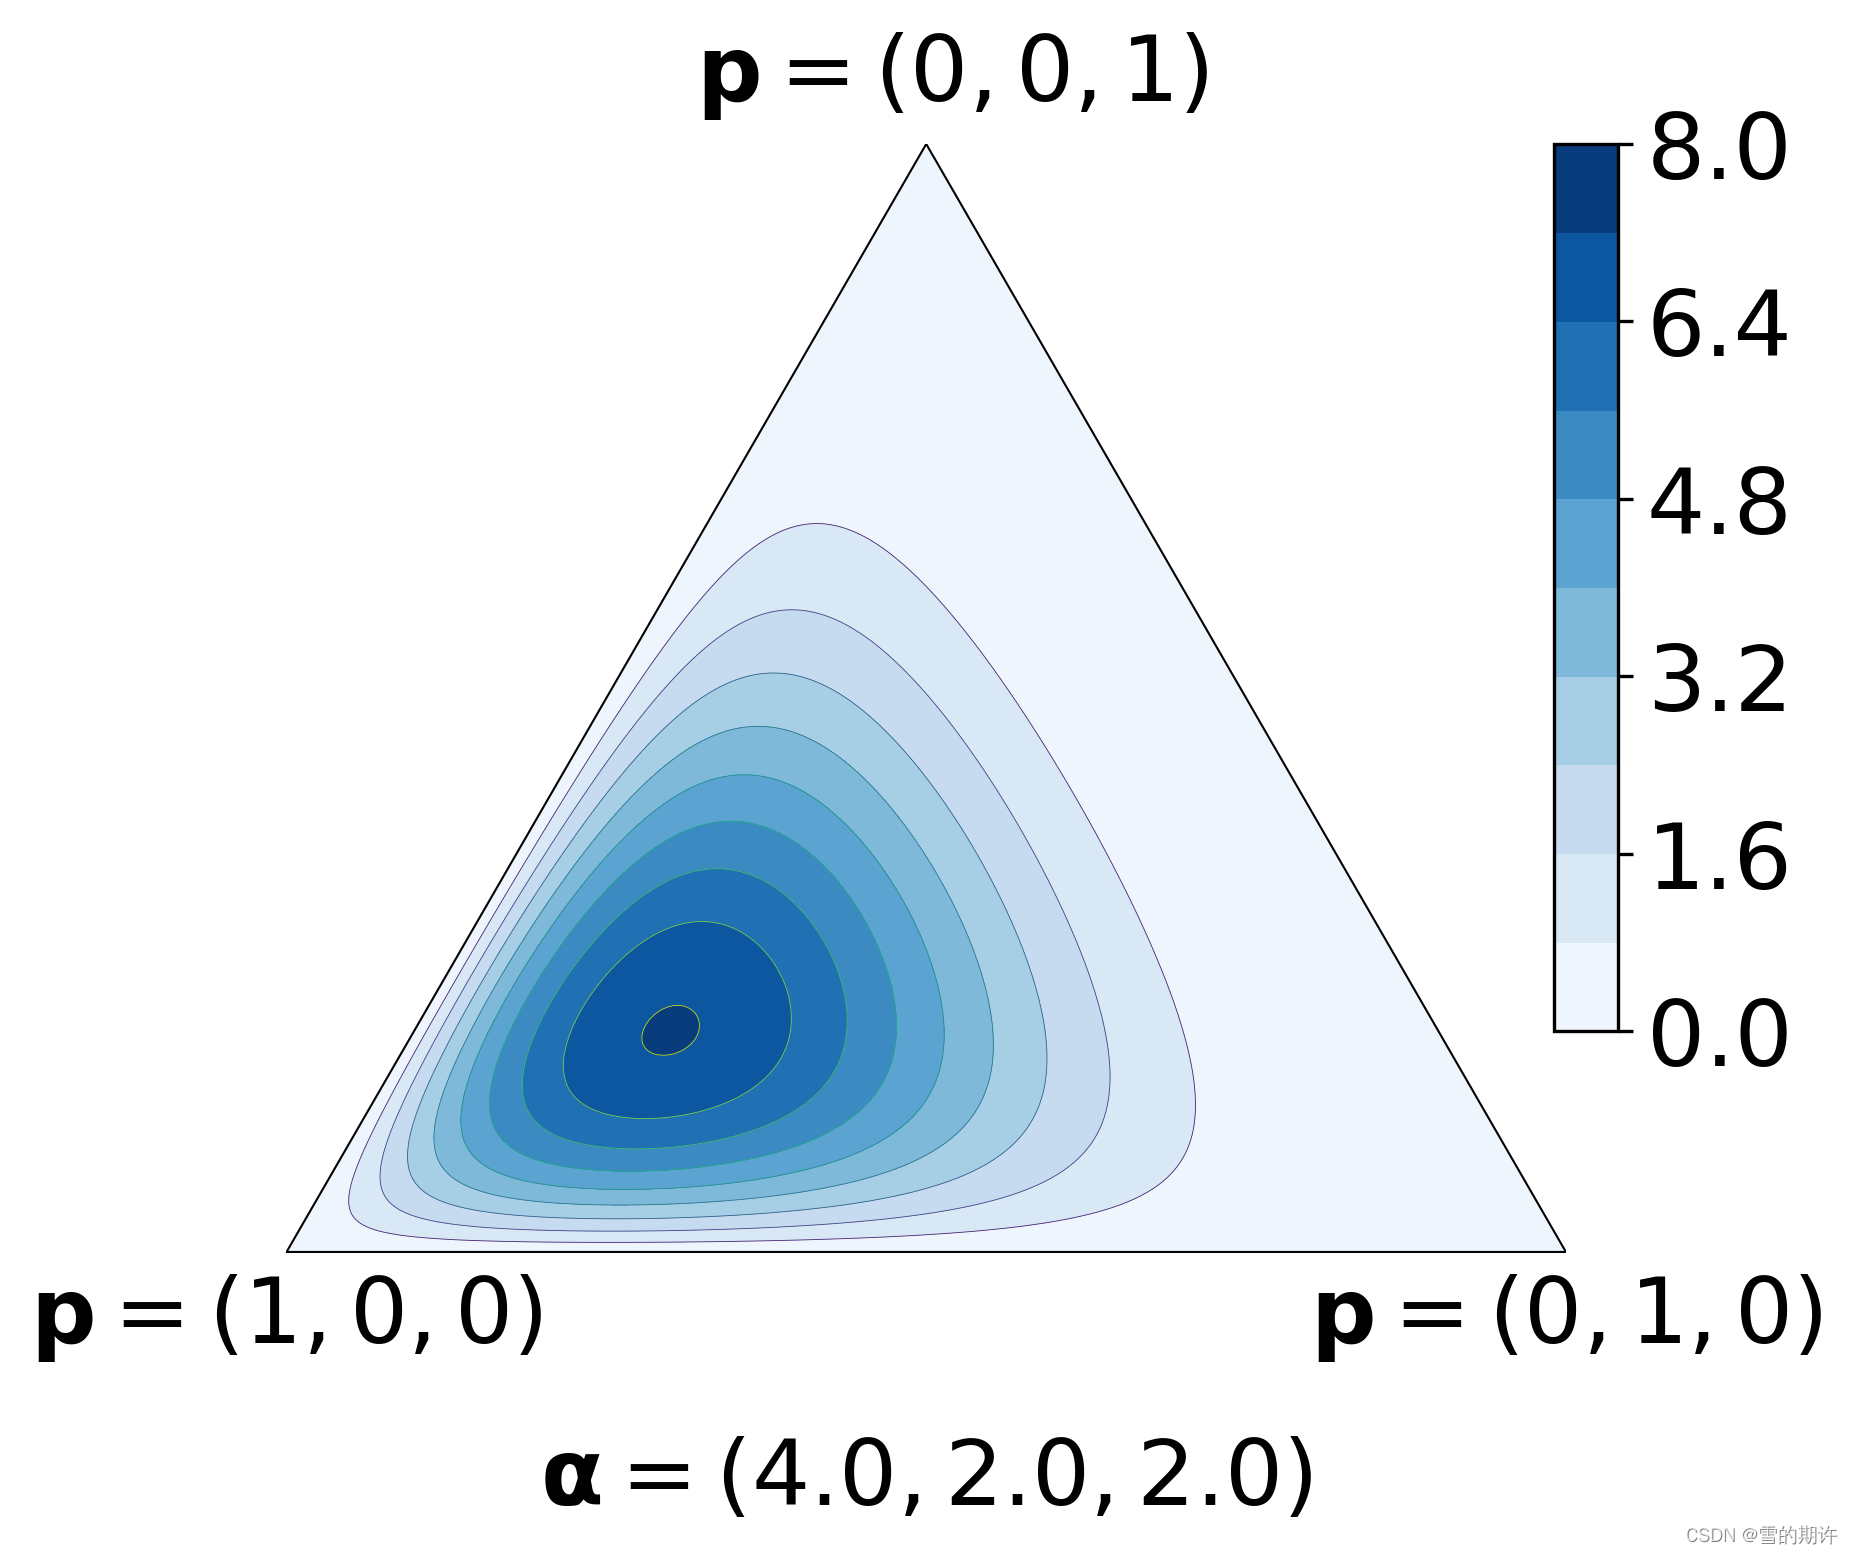
draw_pdf_contours(Dirichlet([4, 2, 2]), nlevels=10, filename='dirichlet-vacuity_prediction')
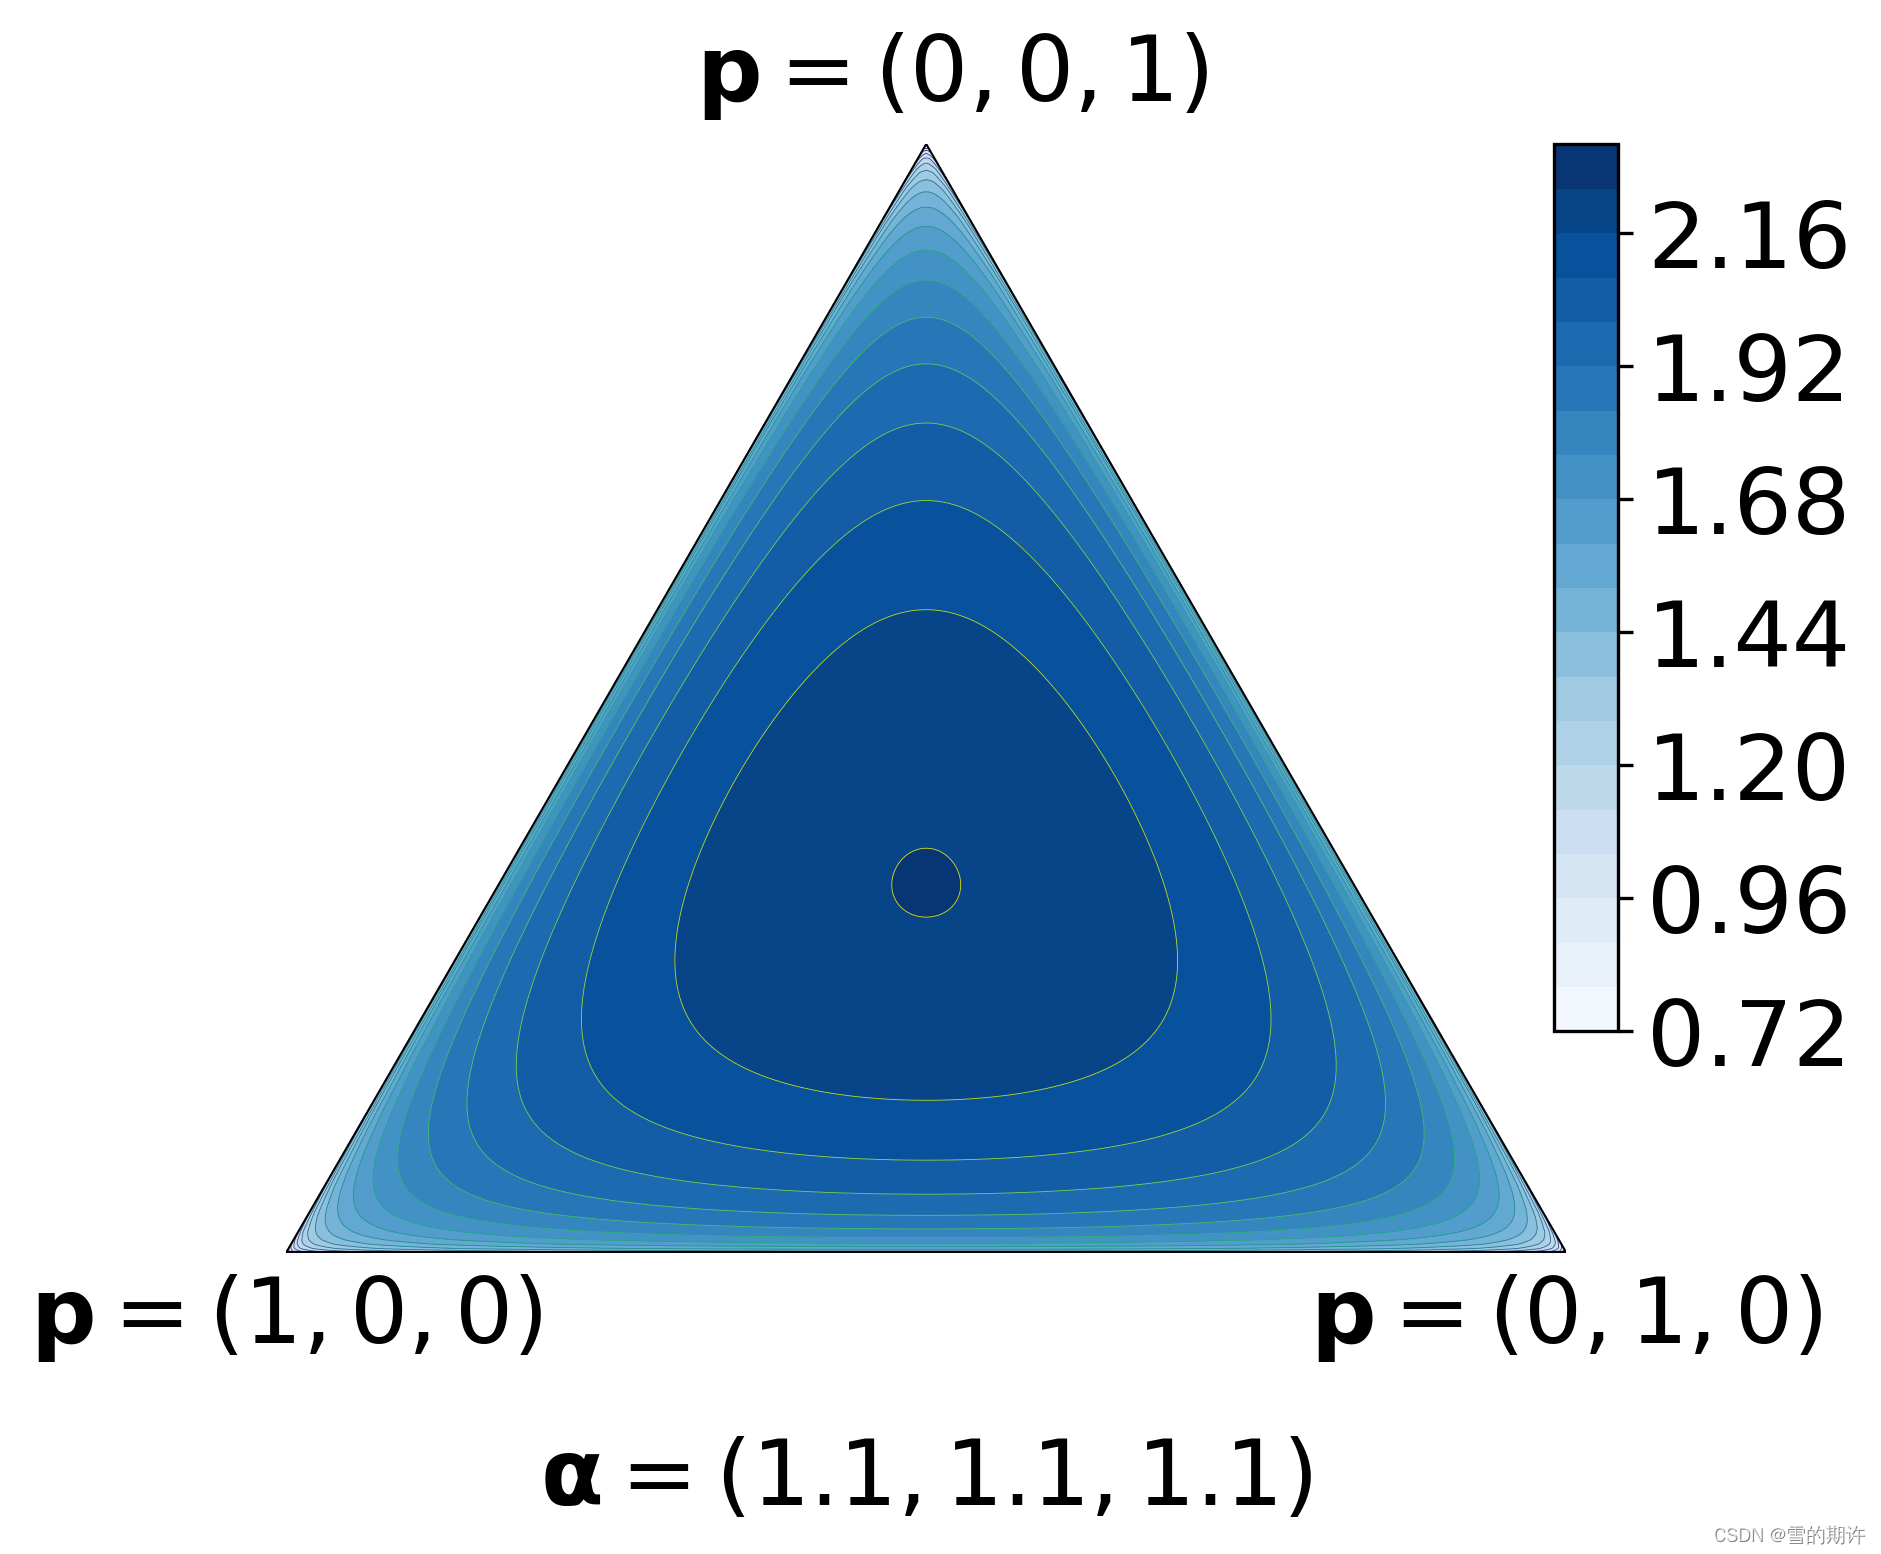
draw_pdf_contours(Dirichlet([1.1, 1.1, 1.1]), nlevels=20, filename='dirichlet-dissonance_prediction')

技术共进,成长同行——讯飞AI开发者社区
更多推荐

 3
3 0
0- 0


 已为社区贡献9条内容

所有评论(0)