机器学习 -Statsmodels
用于探索数据, 估计模型, 并运行统计检验.
·
Statsmodels
用于探索数据, 估计模型, 并运行统计检验.
conda install -y statsmodels
线性回归
import numpy as np
import pandas as pd
import matplotlib.pyplot as plt
import statsmodels.api as sm
import statsmodels.datasets.utils as du
import seaborn as sns

%matplotlib inline
%reload_ext autoreload
%autoreload 2

print(sm.__version__)
0.13.5
# 查看 datasets
# https://github.com/vincentarelbundock/Rdatasets/blob/master/datasets.csv
# https://vincentarelbundock.github.io/Rdatasets/articles/data.html
beauty = sm.datasets.get_rdataset('TeachingRatings', 'AER')
# print(beauty.__doc__)
beauty.data.head()
| minority | age | gender | credits | beauty | eval | division | native | tenure | students | allstudents | prof | |
|---|---|---|---|---|---|---|---|---|---|---|---|---|
| 0 | yes | 36 | female | more | 0.289916 | 4.3 | upper | yes | yes | 24 | 43 | 1 |
| 1 | no | 59 | male | more | -0.737732 | 4.5 | upper | yes | yes | 17 | 20 | 2 |
| 2 | no | 51 | male | more | -0.571984 | 3.7 | upper | yes | yes | 55 | 55 | 3 |
| 3 | no | 40 | female | more | -0.677963 | 4.3 | upper | yes | yes | 40 | 46 | 4 |
| 4 | no | 31 | female | more | 1.509794 | 4.4 | upper | yes | yes | 42 | 48 | 5 |
OLS是普通最小二乘法(Ordinary Least Squares)的缩写,它是一种线性回归模型。
在statsmodels库中,可以使用OLS()方法进行线性回归,并通过.fit()方法进行模型拟合。
然后,可以调用.summary()方法输出回归结果的摘要,它包含以下主要字段:
Model: 模型概述,包括模型公式、方法、样本量等Dep. Variable: 依变量YIndep. Variables: 自变量XR-squared: 确定系数R方,衡量模型的解释能力,范围0-1,值越高表示模型解释能力越强Adj. R-squared: 调整后的R方,对样本量的影响进行校正F-statistic: F统计量,用于检验整个回归模型是否显著Prob (F-statistic): F统计量的P值,小于显著性水平(如0.05)则拒绝原假设,认为模型是显著的Log-Likelihood: 对数似然函数值AIC: 赤池信息量,用于 model selectionBIC: 贝叶斯信息量,与AIC一起用于 model selection
对于每个自变量:
Coef: 回归系数,表示该变量对依变量Y的影响程度Std.Err: 回归系数的标准误t: t统计量,用于检验该自变量在模型中是否显著P>|t|: t统计量的P值,小于显著性水平则认为该自变量显著影响YConf. Int.: 该回归系数的置信区间
.summary()方法输出的结果包含了线性回归模型中最为关键的诊断统计量和 chaque 参数的统计学检验结果。通过这些结果,可以全面判断模型的质量和各自变量的影响。
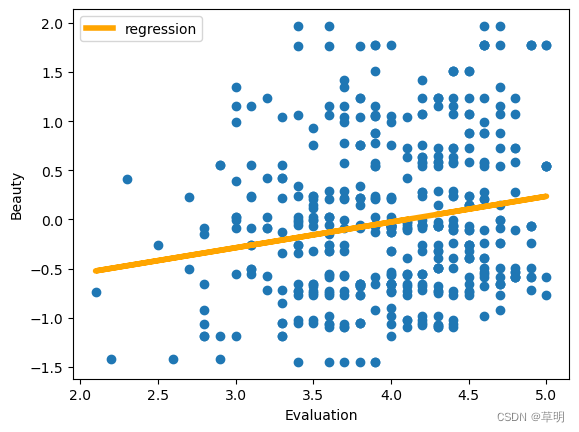
y = beauty.data['beauty']
x1 = beauty.data['eval']
plt.scatter(x1, y)
plt.xlabel('Evaluation')
plt.ylabel('Beauty')

x = sm.add_constant(x1)
result = sm.OLS(y, x).fit()

print(result.summary())

yhat = 0.262 * x1 - 1.0743
fig = plt.plot(x1, yhat, lw=4, c='orange', label='regression')
plt.legend()

plt.show()
                            OLS Regression Results
==============================================================================
Dep. Variable:                 beauty   R-squared:                       0.036
Model:                            OLS   Adj. R-squared:                  0.034
Method:                 Least Squares   F-statistic:                     17.08
Date:                Thu, 27 Apr 2023   Prob (F-statistic):           4.25e-05
Time:                        15:25:50   Log-Likelihood:                -538.11
No. Observations:                 463   AIC:                             1080.
Df Residuals:                     461   BIC:                             1088.
Df Model:                           1
Covariance Type:            nonrobust
==============================================================================
                 coef    std err          t      P>|t|      [0.025      0.975]
------------------------------------------------------------------------------
const         -1.0743      0.262     -4.094      0.000      -1.590      -0.559
eval           0.2687      0.065      4.133      0.000       0.141       0.396
==============================================================================
Omnibus:                       25.836   Durbin-Watson:                   0.962
Prob(Omnibus):                  0.000   Jarque-Bera (JB):               24.678
Skew:                           0.512   Prob(JB):                     4.38e-06
Kurtosis:                       2.518   Cond. No.                         31.2
==============================================================================

Notes:
[1] Standard Errors assume that the covariance matrix of the errors is correctly specified.

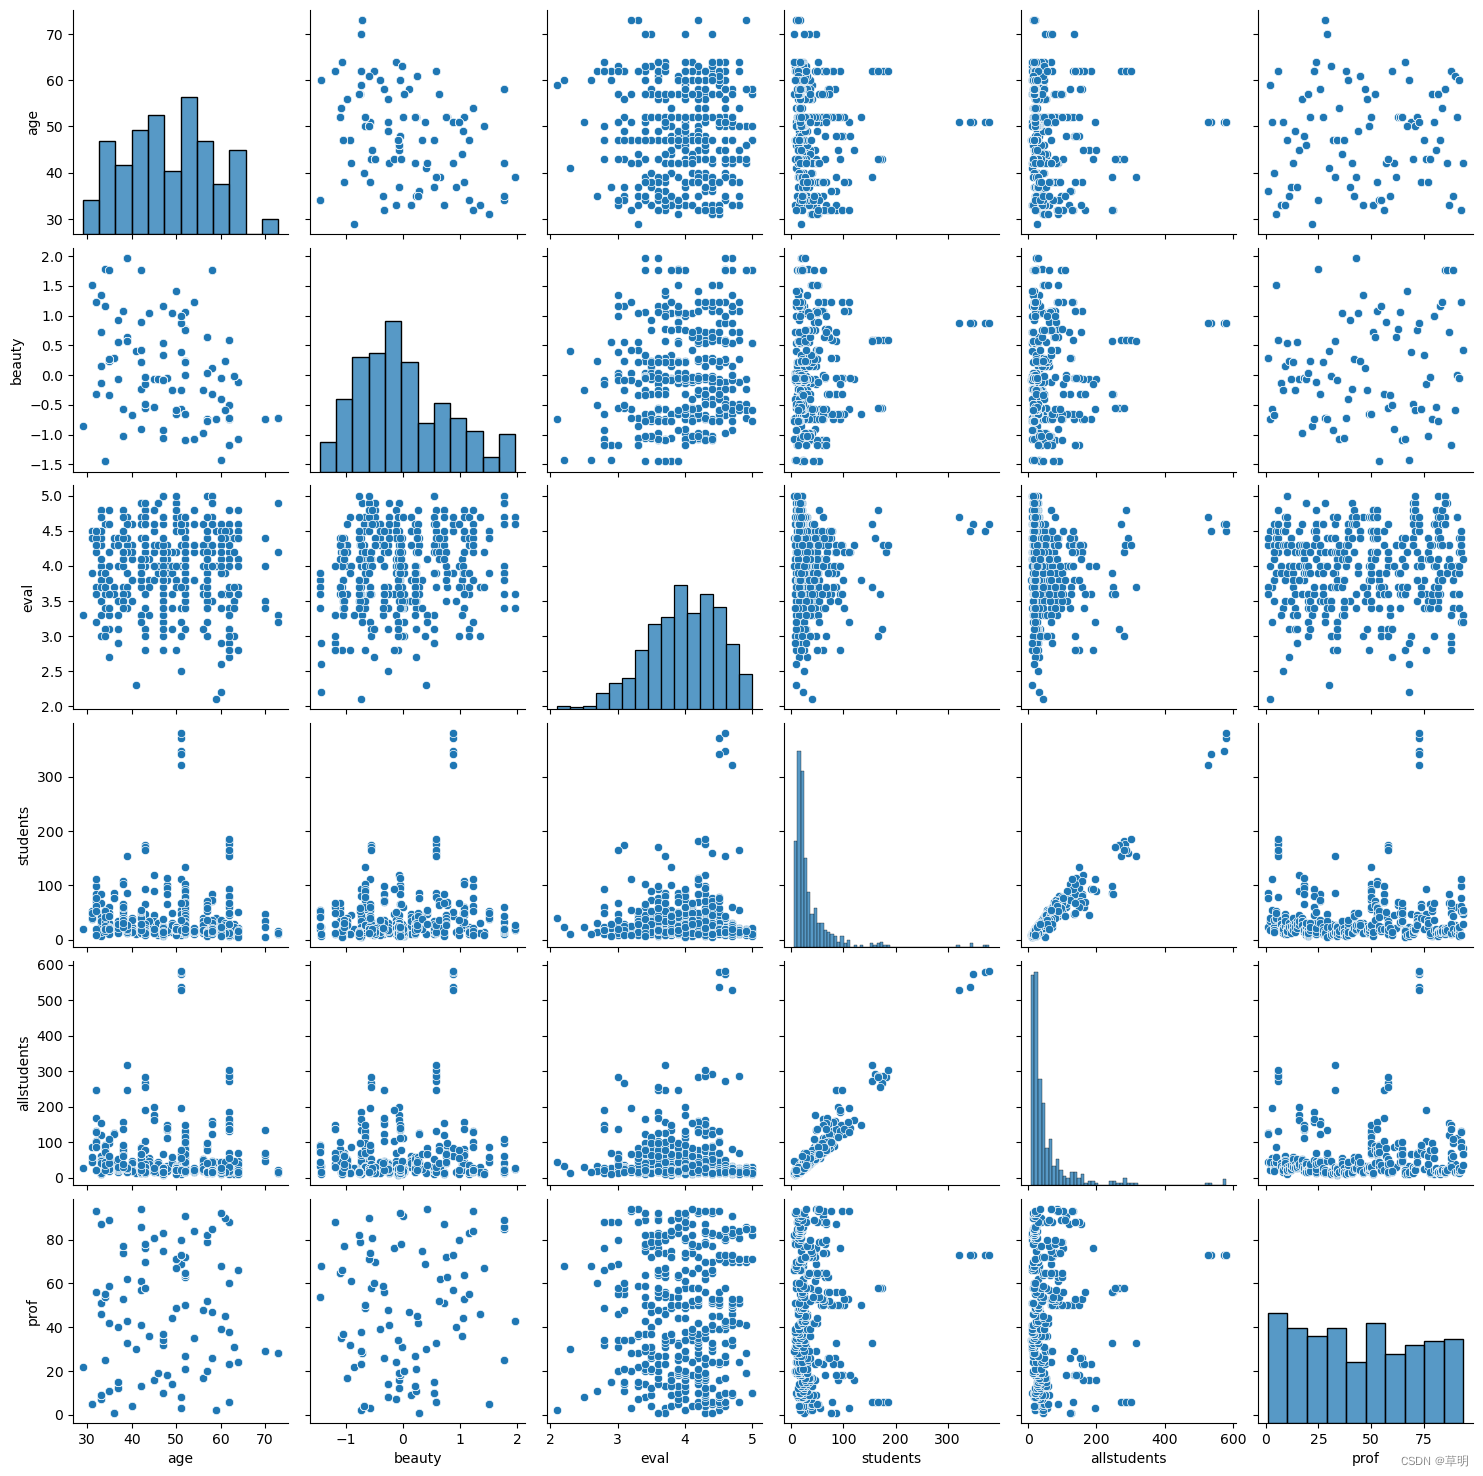
sns.pairplot(beauty.data)

plt.show()

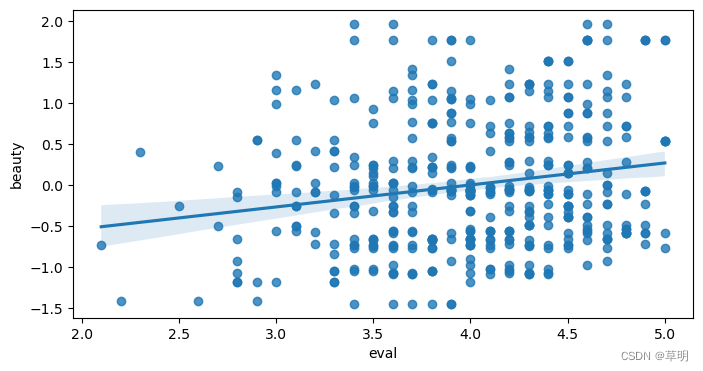
plt.figure(figsize=(8, 4))
sns.regplot(x='eval', y='beauty', data=beauty.data)

plt.show()

tips = sns.load_dataset('tips')
tips.head()
| total_bill | tip | sex | smoker | day | time | size | |
|---|---|---|---|---|---|---|---|
| 0 | 16.99 | 1.01 | Female | No | Sun | Dinner | 2 |
| 1 | 10.34 | 1.66 | Male | No | Sun | Dinner | 3 |
| 2 | 21.01 | 3.50 | Male | No | Sun | Dinner | 3 |
| 3 | 23.68 | 3.31 | Male | No | Sun | Dinner | 2 |
| 4 | 24.59 | 3.61 | Female | No | Sun | Dinner | 4 |
tips.columns
Index(['total_bill', 'tip', 'sex', 'smoker', 'day', 'time', 'size'], dtype='object')
y = tips['total_bill']
x1 = tips['tip']

x = sm.add_constant(x1)

result = sm.OLS(y, x).fit()
result.summary()
| Dep. Variable: | total_bill | R-squared: | 0.457 |
|---|---|---|---|
| Model: | OLS | Adj. R-squared: | 0.454 |
| Method: | Least Squares | F-statistic: | 203.4 |
| Date: | Thu, 27 Apr 2023 | Prob (F-statistic): | 6.69e-34 |
| Time: | 15:25:58 | Log-Likelihood: | -804.77 |
| No. Observations: | 244 | AIC: | 1614. |
| Df Residuals: | 242 | BIC: | 1621. |
| Df Model: | 1 | ||
| Covariance Type: | nonrobust |
| coef | std err | t | P>|t| | [0.025 | 0.975] | |
|---|---|---|---|---|---|---|
| const | 6.7503 | 1.006 | 6.707 | 0.000 | 4.768 | 8.733 |
| tip | 4.3477 | 0.305 | 14.260 | 0.000 | 3.747 | 4.948 |
| Omnibus: | 58.831 | Durbin-Watson: | 2.094 |
|---|---|---|---|
| Prob(Omnibus): | 0.000 | Jarque-Bera (JB): | 120.799 |
| Skew: | 1.185 | Prob(JB): | 5.87e-27 |
| Kurtosis: | 5.502 | Cond. No. | 8.50 |
Notes:
[1] Standard Errors assume that the covariance matrix of the errors is correctly specified.
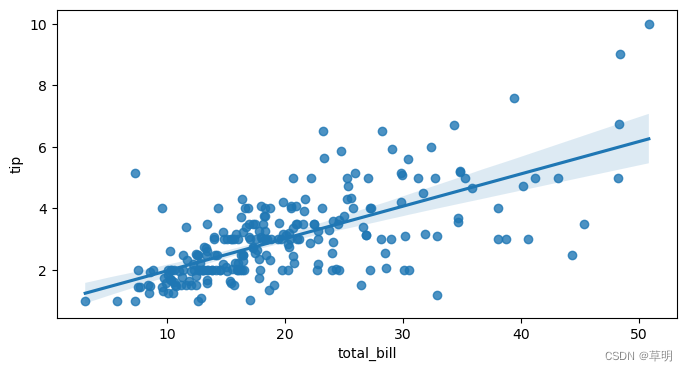
plt.figure(figsize=(8, 4))

sns.regplot(x='total_bill', y='tip', data=tips)

plt.show()

更多推荐
 已为社区贡献8条内容


所有评论(0)