
线性神经网络(异或)
import numpy as npimport matplotlib.pyplot as pltfrom math import sqrtfrom sklearn import linear_modelimport randomdef create_data():X=np.array([[1,3,3],[1,4,3],[1,1,1],[1,0,2]])Y= n.
·
import numpy as np
import matplotlib.pyplot as plt
from math import sqrt
from sklearn import linear_model
import random
def create_data():
X=np.array(
[
[1,3,3],
[1,4,3],
[1,1,1],
[1,0,2]
])
Y= np.array(
[
[1],
[1],
[-1],
[-1]
] )
return X,Y
def update_ws(X,Y,W,lr=0.01):
V= np.dot(X,W)#np.dot(X,W) array矩阵相乘 4*3乘3*1等于4*1
W_ =lr*(X.T.dot(Y-V))/int(X.shape[0])#np.dot(X,W) array矩阵相乘 3*4乘4*1等于3*1
W = W+W_
return W
def main():
x_,y_=create_data()
W= (np.random.random([3,1])-0.5)*2
for i in range(300):
W= update_ws(x_,y_,W,0.05)
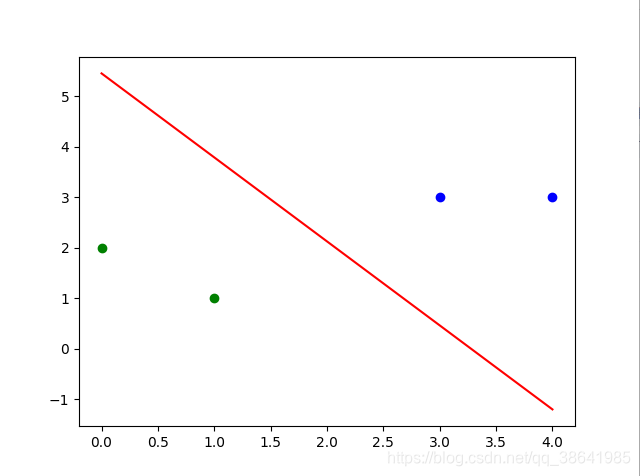
x1 = [3,4]
y1 = [3,3]
x2 = [1,0]
y2 = [1,2]
k= -W[1]/W[2]
b= -W[0]/W[2]
print ("k = {},b= {}".format(k,b));
x_axis =(0,4)
#plt.plot(x1[0],x1[1],'b.')
#plt.plot(y1[0],y1[1],'b.')
#plt.plot(x2[0],x2[1],'g.')
#plt.plot(y2[0],y2[1],'g.')
plt.plot(x_axis,x_axis*k+b,'r')
plt.scatter(x1,y1,c='b')
plt.scatter(x2,y2,c='g')
plt.show()
main()
import numpy as np
import matplotlib.pyplot as plt
from math import sqrt
from sklearn import linear_model
import random
def create_data():
X=np.array(
[
[1,0,0,0,0,0],
[1,0,1,0,0,1],
[1,1,0,1,0,0],
[1,1,1,1,1,1]
])
Y= np.array(
[
[-1],
[1],
[1],
[-1]
] )
return X,Y
def update_ws(X,Y,W,lr=0.01):
V= (np.dot(X,W))#np.dot(X,W) array矩阵相乘 4*3乘3*1等于4*1
W_ =lr*(X.T.dot(Y-V))/int(X.shape[0])#np.dot(X,W) array矩阵相乘 3*4乘4*1等于3*1
W = W+W_
return W
def calc_(x,w,r):
a=w[5]
b=w[2]+x*w[4]
c=w[0]+x*w[1]+x*x*w[3]
if r == 1:
return (-b+np.sqrt(b*b-4*a*c))/(2*a)
elif r == 2:
return (-b-np.sqrt(b*b-4*a*c))/(2*a)
def main():
x_,y_=create_data()
W= (np.random.random([6,1])-0.5)*2
for i in range(10000):
W= update_ws(x_,y_,W,0.11)
x1 = [0,1]
y1 = [1,0]
x2 = [0,1]
y2 = [0,1]
#W =np.concatenate((W),axis=0)#水平组合
print ("w = {}".format(W))
#print ("root1 = {}".format(calc_(x_,W,1)))
#print ("root2 = {}".format(calc_(x_,W,2)))
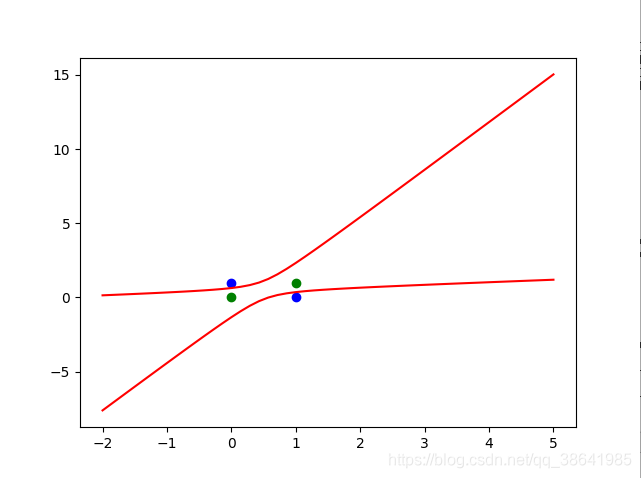
x_data =np.linspace(-2,5)
plt.plot(x_data,calc_(x_data,W,1),'r')
plt.plot(x_data,calc_(x_data,W,2),'r')
plt.scatter(x1,y1,c='b')
plt.scatter(x2,y2,c='g')
plt.show()
main()
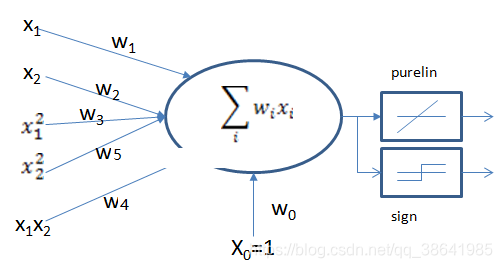
W0*X0+X1*W1+X2*W2+X1^2*W3 +X1*X2*W4 + X2^2*W5 = 0
令X1=X ,X2=Y;
W0 + X*W1 +Y*W2 + X^2*W3 + X*Y*W4+ Y^2*W5 = 0
根据a*x^2+b*x+c=0求解知;
a*Y^2+b*Y+c=0可推出;
c = W0+X*W1+ X^2*W3
b=X*W4+W2
a=W5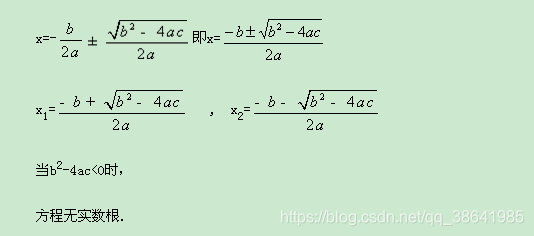

技术共进,成长同行——讯飞AI开发者社区
更多推荐


 0
0 0
0- 0


 已为社区贡献9条内容

所有评论(0)