
【前端学习】AntV G6-09 复杂的自定义边、边动画
AntV G6-09 复杂的自定义边、边动画
课程视频
AntV G6:复杂的自定义边、边动画(上)_哔哩哔哩_bilibili
AntV G6:复杂的自定义边、边动画(下)_哔哩哔哩_bilibili
讲义截图

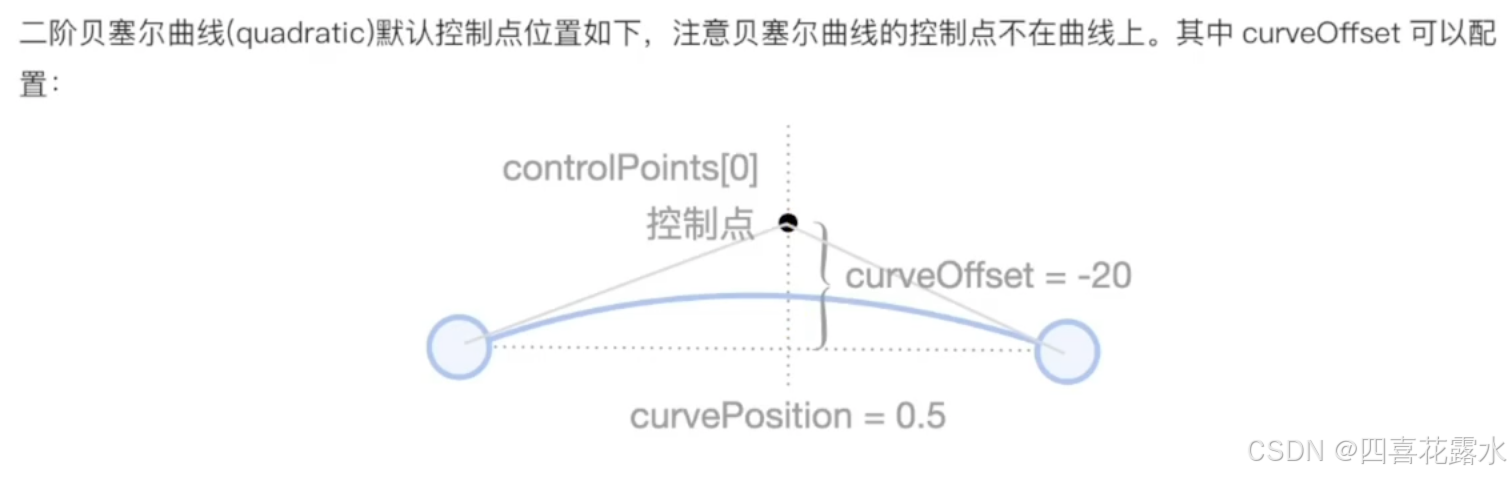
G6有2种内置的曲线,二阶贝塞尔曲线和三阶贝塞尔曲线。它们的区别就是控制点个数的多少。
二阶贝塞尔曲线如果算上两个端点,其实总共有三个控制点。但我们通过边的配置control points,可以指定中间这个控制点的位置,从而控制这条贝塞尔曲线的弯曲方式。当我们不指定control points的时候,也可以通过配置curve position和curveOffSet两个字段来间接的指定控制点的位置。curve position指的是这条边的起点到终点连线所在的0到1的一个百分比位置,默认情况下的curve position是他们的中央,也就是0.5。curve position指的是这个控制点到这个两端点连线的距离。
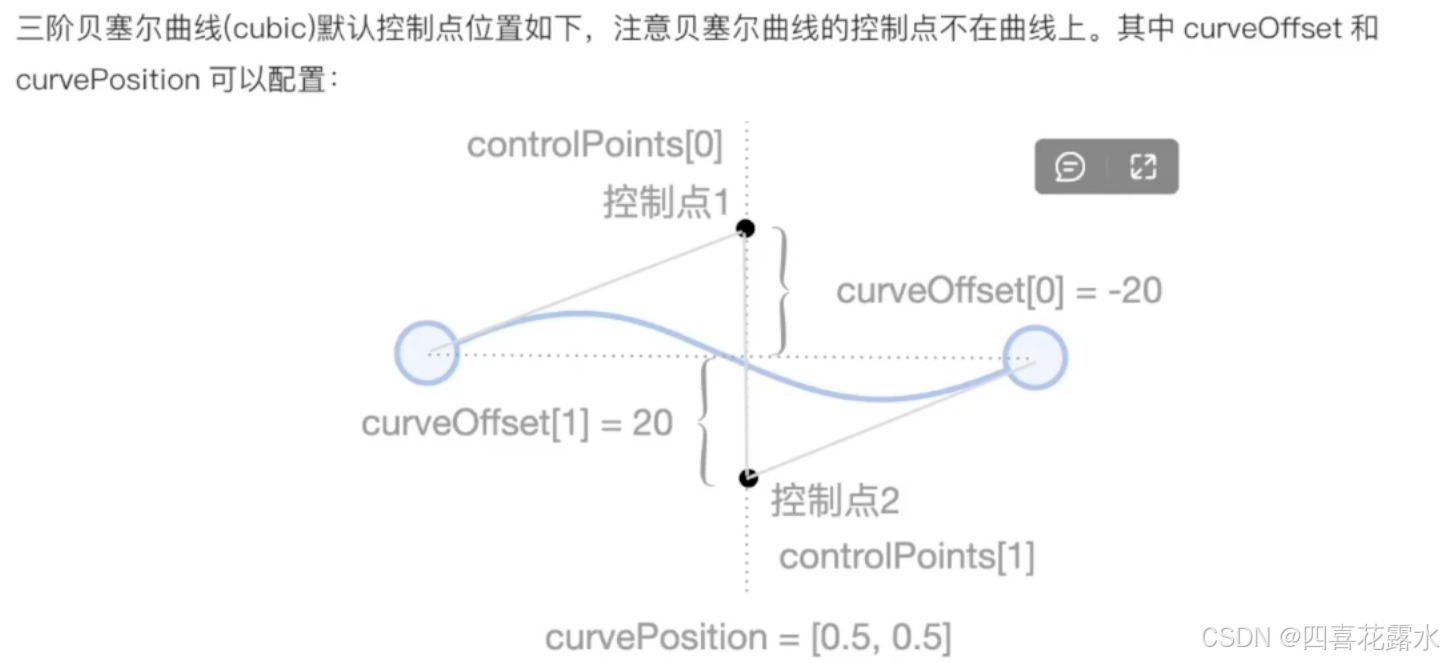
三阶贝塞尔曲线则是有两个控制点,可以通过配置边的control points为2个XY对象控制这条边的绘制方式。当然也同样的在不指定control points的时候,指定current position和curveOffSet来间接指定它们的弯曲方式。默认情况下,三阶贝塞尔曲线的curve position也是在两端点连线的中央位置。由于它是有两个控制点,所以它是一个二维数组。curveOffSet同样也是一个二维数组,分别指定第一个和第二个控制点距离这个连线的距离。
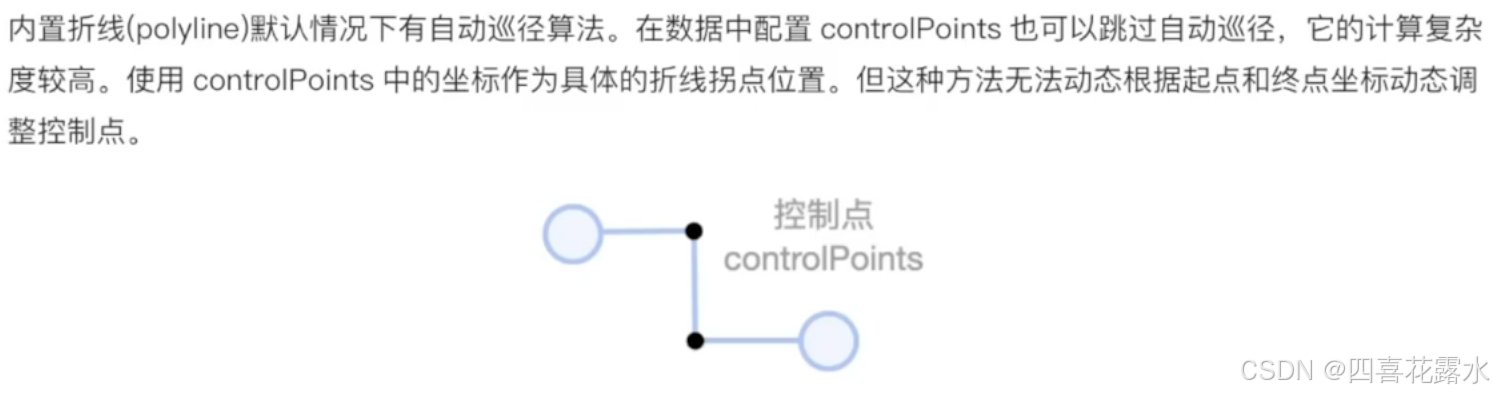
我们可以发现贝塞尔曲线的控制点实际上并不在这个曲线上,折线则不同,折线的控制点是实际上就是折线的拐点,这些控制点在折线上。通过配置control points,我们可以指定任意个数、任意位置的控制点。当我们不指定control points的时候,内置的折线poly line将会使用 A* 自动寻径的算法,但这个算法计算复杂度比较高。而使用control points的坐标作为具体的拐折点位置,没有办法动态的根据起点和终点去调整折线的弯曲。因此很多情况下我们会为了性能和美观的考虑,结合自己的业务诉求去自定义折现的路径。
提及链接
https://codesandbox.io/p/sandbox/register-polyline-getpath-jkd6dn


实例讲解
(从第一个课程链接的04:10开始)
【视频代码(附注释)】
<!DOCTYPE html>
<html>

<head>
	<meta charset="UTF-8">
	<title>07 复杂的自定义边、边动画</title>
	<!-- 引入 G6 -->
	<script src="https://gw.alipayobjects.com/os/lib/antv/g6/4.3.11/dist/g6.min.js"></script>
	<!-- <script src="https://gw.alipayobjects.com/os/lib/antv/g6/3.7.1/dist/g6.min.js"></script> -->
</head>

<body>
	<div id="container"></div>
	<script>
		// 思路
		// 1.自定义(边类型)折线 G6.registerEdge, 复写getPath方法
		// 2.复写afterDraw方法 增加hover效果
		// 3.当鼠标进入边时更改边设置状态 graph.on('edge:mouseenter'...
		// 4.捕获状态变化 setState()
		// 5.afterUpdate 更新halo路径,与keyShape同步
		// 6.afterUpdate 更新endLabel位置,与keyShape同步
		// 7.动画,点击端点的时候相关的边产生虚线

		const { getLabelPosition, transform } = G6.Util;

		// 控制path的虚线运动
		const lineDashAnimate = (path) => {
			const lineDash = [6, 4, 2, 4];
			path.attr('lineDash', lineDash)
			let index = 0;
			path.stopAnimate();
			path.animate((ratio) => {
				index++
				if (index > 16) {
					index = 0
				}
				return {
					lineDashOffset: index
				}
			}, {
				repeat: true, // whether executes the animation repeatly
				duration: 3000 // the duration for executing once
			})

		}

		// 自定义(边类型)折线
		// 参数1 边的名字,参数2 复写,参数3 继承的边类型
		G6.registerEdge('custom-polyline', {
			// 复写getPath方法,它定义类这个边的绘制路径,points是这条边的起点和终点2个位置
			getPath(points) {
				const [sourcePoint, endPoint] = points;
				// 我们希望这两个拐点的位置在2个端点的连线的中间
				const x = (sourcePoint.x + endPoint.x) / 2;
				const y1 = sourcePoint.y;
				const y2 = endPoint.y;
				// 绘制路径,参考SVG的画法
				const path = [
					['M', sourcePoint.x, sourcePoint.y],
					['L', x, y1],
					['L', x, y2],
					['L', endPoint.x, endPoint.y]
				]
				return path;
			},
			// 复写afterDraw方法 增加hover效果 绘制endLabel
			// 参数1 边的配置,参数2 边的图形分组
			afterDraw(cfg, group) {
				// 因为custom-polyline继承自polyline,所以path的name是已经被定义好的,叫edge-shape
				const keyShape = group.find(ele => ele.get('name') === 'edge-shape')
				const style = keyShape.attr()
				// 在group中增加一个图形
				const halo = group.addShape('path', {
					attrs: {
						...style, // 把原有的style复制进来,再在下面叠加新的样式
						lineWidth: 5,
						opacity: 0.3
					},
					name: 'edge-halo'
				})
				halo.hide() // 需要hover时显示,所以先隐藏起来

				// 绘制endLabel
				const { endLabel, endPoint = { x: 0, y: 0 }, labelCfg = {} } = cfg
				const { style: labelStyle, refX = 0, refY = 0 } = labelCfg
				if (endLabel) {
					group.addShape('text', {
						attrs: {
							x: endPoint.x - refX,
							y: endPoint.y + refY,
							text: endLabel,
							fontSize: 12,
							fill: '#000',
							textAlign: 'right',
							textBaseline: 'middle',
							...labelStyle
						},
						name: 'edge-end-label'
					})
				}
			},
			// afterUpdate 更新halo路径、更新endLabel位置,与keyShape同步
			// 参数1 配置项,参数2 边item元素
			afterUpdate(cfg, item) {
				// 更新halo路径
				const group = item.getContainer()
				const keyShape = group.find(ele => ele.get('name') === 'edge-shape')
				const halo = group.find(ele => ele.get('name') === 'edge-halo')
				const path = keyShape.attr('path')
				halo.attr('path', path)

				// 更新endLabel位置
				const { endLabel, endPoint = { x: 0, y: 0 }, labelCfg } = cfg
				const { refX = 0, refY = 0 } = labelCfg
				const endLabelShape = group.find(ele => ele.get('name') === 'edge-end-label')
				if (!endLabel) {
					endLabelShape.hide()
				} else {
					endLabelShape.show()
					endLabelShape.attr({
						text: endLabel,
						x: endPoint.x - refX,
						y: endPoint.y + refY,
					})
				}
			},
			// 捕获状态变化
			// 参数1 状态名称, 参数2 状态值,参数3 边 item本身
			setState(name, value, item) {
				const group = item.getContainer()
				if (name === 'hover') {
					const halo = group.find(ele => ele.get('name') === 'edge-halo')
					if (value) {
						halo.show()
					} else {
						halo.hide()
					}
				} else if (name === 'selected') {
					const keyShape = group.find(ele => ele.get('name') === 'edge-shape')
					if (value) {
						lineDashAnimate(keyShape)
					} else {
						keyShape.stopAnimate()
						keyShape.attr('lineDash', undefined) // 恢复直线
					}
				}
			}
		}, 'polyline')


		const data = {
			nodes: [
				{
					id: "7",
					x: 150,
					y: 100
				},
				{
					id: "8",
					x: 300,
					y: 200
				}
			],
			edges: [
				{
					source: "7",
					target: "8",
					label: "xxx",
					endLabel: "yyy"
				}
			]
		};
		const container = document.getElementById("container");
		const width = container.scrollWidth;
		const height = container.scrollHeight || 500;
		const graph = new G6.Graph({
			container: "container",
			width,
			height,
			// translate the graph to align the canvas's center, support by v3.5.1
			fitCenter: true,
			modes: {
				// behavior
				default: ["drag-node", "drag-canvas", "click-select"]
			},
			defaultNode: {
				type: "circle",
				size: 40,
				style: {
					fill: "#DEE9FF",
					stroke: "#5B8FF9"
				},
				// 把左右的小圆点展示出来,linkPoints只是展示小圆点,边需要配置一下anchorPoints才能连接到它上面
				linkPoints: {
					left: true,
					right: true,
					size: 5
				},
				// anchorPoints 指定边连入的位置
				anchorPoints: [
					[0, 0.5],
					[1, 0.5],
				]
			},
			defaultEdge: {
				// type: "polyline", // 如果没有为边指定controlPoints,它将使用A*自动巡径算法
				type: "custom-polyline", // 使用自定义(边类型)折线
				color: "#F6BD16",
				// 配置文本
				labelCfg: {
					position: 'start',
					refX: 10
				}
			}
		});

		graph.data(data);
		graph.render();

		// 当鼠标进入边上的时候给边设置状态 hover true
		graph.on('edge:mouseenter', e => {
			graph.setItemState(e.item, 'hover', true)
		})
		// 当鼠标离开边上的时候给边设置状态 hover false
		graph.on('edge:mouseleave', e => {
			graph.setItemState(e.item, 'hover', false)
		})
		// 取消edge边所有状态
		const clearEdgeStates = () => {
			const selectedEdges = graph.findAllByState("edge","selected");
			selectedEdges.forEach(edge => {
				graph.setItemState(edge, 'selected', false)
			})
		}
		// 节点监听 点击端点产生虚线的
		graph.on('node:click', e => {
			clearEdgeStates()
			const edges = e.item.getEdges()
			edges.forEach(edge => {
				graph.setItemState(edge, 'selected', true)
			})
		})
		// 点击画布取消所有edge边状态
		graph.on('canvas:click', e => {
			clearEdgeStates()
		})

		if (typeof window !== "undefined")
			window.onresize = () => {
				if (!graph || graph.get("destroyed")) return;
				if (!container || !container.scrollWidth || !container.scrollHeight) return;
				graph.changeSize(container.scrollWidth, container.scrollHeight);
			};
	</script>
</body>

</html>
【sandbox代码(细节更完善)】
<!DOCTYPE html>
<html>

<head>
    <meta charset="UTF-8">
    <title>07 复杂的自定义边、边动画</title>
    <!-- 引入 G6 -->
    <script src="https://gw.alipayobjects.com/os/lib/antv/g6/4.3.11/dist/g6.min.js"></script>
    <!-- <script src="https://gw.alipayobjects.com/os/lib/antv/g6/3.7.1/dist/g6.min.js"></script> -->
</head>

<body>
    <div id="container"></div>
    <script>
        const { getLabelPosition, transform } = G6.Util;

        const addAnimateArrow = (path, group, arrowStyle) => {
            const arrow =
                group.find((ele) => ele.get("name") === "animate-arrow") ||
                group.addShape("marker", {
                    attrs: {
                        stroke: "#3370ff",
                        fill: "#fff",
                        ...arrowStyle,
                        x: 16,
                        y: 0,
                        r: 8,
                        lineWidth: 2,
                        symbol: (x, y, r) => {
                            return [
                                ["M", x - 8, y - 8],
                                ["L", x - 2, y],
                                ["L", x - 8, y + 8]
                            ];
                        }
                    },
                    name: "animate-arrow"
                });

            arrow.stopAnimate();

            // animation for the red circle
            arrow.animate(
                (ratio) => {
                    // the operations in each frame. Ratio ranges from 0 to 1 indicating the prograss of the animation. Returns the modified configurations
                    // get the position on the edge according to the ratio
                    const tmpPoint = path.getPoint(ratio);
                    const roundPoint = {
                        x: Math.round(tmpPoint.x),
                        y: Math.round(tmpPoint.y)
                    };
                    const pos = getLabelPosition(path, ratio);
                    let matrix = [1, 0, 0, 0, 1, 0, 0, 0, 1];
                    matrix = transform(matrix, [
                        ["t", -roundPoint.x, -roundPoint.y],
                        ["r", pos.angle],
                        ["t", roundPoint.x, roundPoint.y]
                    ]);

                    // returns the modified configurations here, x and y here
                    return {
                        x: tmpPoint.x,
                        y: tmpPoint.y,
                        matrix
                    };
                },
                {
                    repeat: true, // Whether executes the animation repeatly
                    duration: 3000 // the duration for executing once
                }
            );
        };

        const lineDashAnimate = (path) => {
            const lineDash = [6, 4, 2, 4];
            path.stopAnimate();
            let index = 0;
            // Define the animation
            path.animate(
                () => {
                    index++;
                    if (index > 9) {
                        index = 0;
                    }
                    const res = {
                        lineDash,
                        lineDashOffset: -index
                    };
                    // returns the modified configurations here, lineDash and lineDashOffset here
                    return res;
                },
                {
                    repeat: true, // whether executes the animation repeatly
                    duration: 3000 // the duration for executing once
                }
            );
        };

        G6.registerEdge(
            "line-arrow",
            {
                getPath(points) {
                    const startPoint = points[0];
                    const endPoint = points[1];
                    return [
                        ["M", startPoint.x, startPoint.y],
                        ["L", endPoint.x / 3 + (2 / 3) * startPoint.x, startPoint.y],
                        ["L", endPoint.x / 3 + (2 / 3) * startPoint.x, endPoint.y],
                        ["L", endPoint.x, endPoint.y]
                    ];
                },
                afterDraw(cfg, group) {
                    const keyShape = group.find((ele) => ele.get("name") === "edge-shape");
                    const attrs = keyShape.attr();
                    const halo = group.addShape("path", {
                        attrs: {
                            ...attrs,
                            lineWidth: 8,
                            opacity: 0.2
                        },
                        name: "edge-halo"
                    });
                    halo.hide();

                    const { endLabel, endPoint, labelCfg } = cfg;
                    const { style: labelStyle = {}, refX = 0, refY = 0 } = labelCfg;
                    if (endLabel) {
                        const endLabelShape = group.addShape("text", {
                            attrs: {
                                text: endLabel,
                                x: endPoint.x - refX,
                                y: endPoint.y + refY,
                                textAlign: "right",
                                fill: "#000",
                                textBaseline: "middle",
                                ...labelStyle
                            },
                            name: "end-label-shape"
                        });
                        console.log("endLabelShape", endLabelShape);
                    }
                },
                afterUpdate(cfg, item) {
                    const group = item.getContainer();
                    const endLabelShape = group.find(
                        (ele) => ele.get("name") === "end-label-shape"
                    );
                    const { endLabel, endPoint, labelCfg } = cfg;
                    const { style: labelStyle = {}, refX = 0, refY = 0 } = labelCfg;
                    endLabelShape.attr({
                        text: endLabel,
                        x: endPoint.x - refX,
                        y: endPoint.y + refY,
                        ...labelStyle
                    });
                },
                setState(name, value, item) {
                    const group = item.getContainer();
                    const keyShapePath = group.find(
                        (ele) => ele.get("name") === "edge-shape"
                    );
                    switch (name) {
                        case "hover":
                            const halo = group.find((ele) => ele.get("name") === "edge-halo");
                            if (value) {
                                const path = keyShapePath.attr("path");
                                halo.show();
                                halo.attr("path", path);
                            } else {
                                halo.hide();
                            }
                            break;
                        case "selected":
                            if (value) {
                                lineDashAnimate(keyShapePath);
                                // addAnimateArrow(keyShapePath, group, keyShapePath.attr());
                            } else {
                                keyShapePath.stopAnimate();
                                keyShapePath.attr("lineDash", undefined);
                                // const arrow = group.find(ele => ele.get('name') === 'animate-arrow');
                                // if (arrow) arrow.remove(true);
                            }
                            break;
                        default:
                            break;
                    }
                }
            },
            "polyline"
        );

        const data = {
            nodes: [
                {
                    id: "7",
                    x: 150,
                    y: 100
                },
                {
                    id: "8",
                    x: 300,
                    y: 200
                }
            ],
            edges: [
                {
                    source: "7",
                    target: "8",
                    label: "xxx",
                    endLabel: "yyy"
                }
            ]
        };

        const container = document.getElementById("container");
        const width = container.scrollWidth;
        const height = container.scrollHeight || 500;
        const graph = new G6.Graph({
            container: "container",
            width,
            height,
            // translate the graph to align the canvas's center, support by v3.5.1
            fitCenter: true,
            modes: {
                // behavior
                default: ["drag-node", "drag-canvas", "click-select"]
            },
            defaultNode: {
                type: "circle",
                size: 40,
                anchorPoints: [
                    [0, 0.5],
                    [1, 0.5]
                ],
                style: {
                    fill: "#DEE9FF",
                    stroke: "#5B8FF9"
                },
                linkPoints: {
                    left: true,
                    right: true,
                    fill: "#fff",
                    stroke: "#1890FF",
                    size: 5
                }
            },
            defaultEdge: {
                type: "line-arrow",
                color: "#F6BD16",
                labelCfg: {
                    autoRotate: true,
                    position: "start",
                    refX: 10
                }
            }
        });

        graph.data(data);
        graph.render();

        graph.on("edge:mouseenter", (e) => {
            graph.setItemState(e.item, "hover", true);
        });
        graph.on("edge:mouseleave", (e) => {
            graph.setItemState(e.item, "hover", false);
        });

        const clearEdgeStates = () => {
            const selectedEdges = graph.findAllByState("selected");
            selectedEdges?.forEach((edge) => graph.setItemState(edge, "selected", false));
        };
        graph.on("node:click", (e) => {
            clearEdgeStates();
            const relatedEdges = e.item.getEdges();
            relatedEdges.forEach((edge) => graph.setItemState(edge, "selected", true));
        });
        graph.on("canvas:click", (e) => clearEdgeStates());

        if (typeof window !== "undefined")
            window.onresize = () => {
                if (!graph || graph.get("destroyed")) return;
                if (!container || !container.scrollWidth || !container.scrollHeight) return;
                graph.changeSize(container.scrollWidth, container.scrollHeight);
            };
    </script>
</body>

</html>

技术共进,成长同行——讯飞AI开发者社区
更多推荐

 11
11 0
0- 0


 已为社区贡献3条内容

所有评论(0)